

Does Newmont (NEM) Pairing Higher Q2 Earnings With Undervaluation Recast Its Risk Reward Profile?
Newmont Corporation NEM | 0.00 |
- In its Q2 2026 results released earlier this week, Newmont reported higher year‑over‑year sales and earnings while reaffirming its full‑year production guidance of around 5.3 million ounces.
- At the same time, the stock screens as modestly undervalued on both discounted cash flow and earnings multiples, even as brokerage ratings and quantitative rankings send conflicting signals about its outlook.
- We’ll now examine how Newmont’s reaffirmed production guidance and apparent valuation discount could influence its existing investment narrative and risk profile.
Capitalize on the AI infrastructure supercycle with our selection of the 55 best 'picks and shovels' of the AI gold rush converting record-breaking demand into massive cash flow.
Newmont Investment Narrative Recap
To own Newmont today, you need to believe in the long term case for a large, diversified gold producer and its ability to convert stable production into solid cash flow. The reaffirmed 2026 guidance of about 5.3 million ounces supports that production story, but the biggest near term risk remains execution and cost control across a changing asset base, rather than this single quarter’s results, which do not materially alter that risk on their own.
The most relevant recent announcement here is the Q2 2026 earnings release, which showed higher year over year sales and earnings alongside that steady production outlook. Combined with a share price that still screens as modestly undervalued on both discounted cash flow and earnings multiples, this update feeds directly into the current debate over whether Newmont’s apparent valuation discount compensates you enough for operational, cost and integration risks.
Yet even with stronger Q2 numbers and reaffirmed guidance, investors should be aware of...
Newmont's narrative projects $31.8 billion revenue and $13.3 billion earnings by 2029. This requires 8.4% yearly revenue growth and about a $4.8 billion earnings increase from $8.5 billion.
Uncover how Newmont's forecasts yield a $141.46 fair value, a 25% upside to its current price.
Exploring Other Perspectives
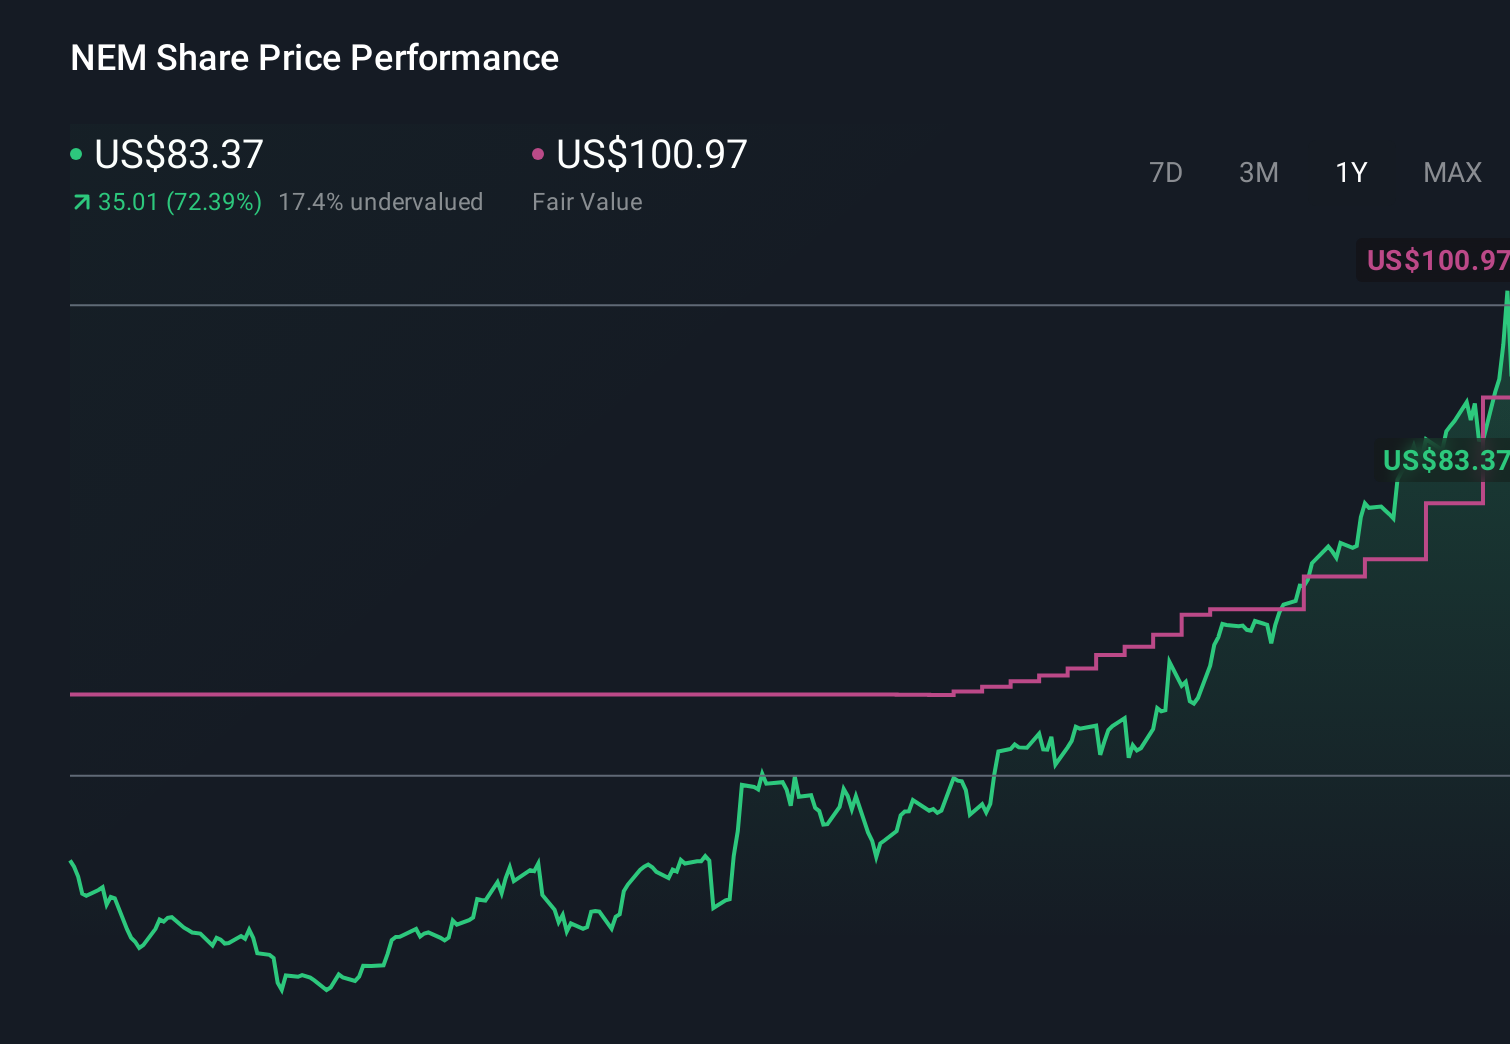
Compared with the consensus view tied to Q2’s higher sales, the lowest analysts were assuming revenue slips about 5 percent a year and earnings of about US$9.4 billion by 2029, so their more cautious story could shift meaningfully as this new information is absorbed.
Explore 11 other fair value estimates on Newmont - why the stock might be worth as much as 57% more than the current price!
Form Your Own Verdict
Disagree with existing narratives? Extraordinary investment returns rarely come from following the herd, so go with your instincts.
- A great starting point for your Newmont research is our analysis highlighting 4 key rewards that could impact your investment decision.
- Our free Newmont research report provides a comprehensive fundamental analysis summarized in a single visual - the Snowflake - making it easy to evaluate Newmont's overall financial health at a glance.
Looking For Alternative Opportunities?
Don't miss your shot at the next 10-bagger. Our latest stock picks just dropped:
- The latest GPUs need a type of rare earth metal called Dysprosium and there are only 28 companies in the world exploring or producing it. Find the list for free.
- The future of work is here. Discover the 36 top robotics and automation stocks leading the charge in AI-driven automation and industrial transformation.
- This technology could replace computers: discover 26 stocks that are working to make quantum computing a reality.
This article by Simply Wall St is general in nature. We provide commentary based on historical data and analyst forecasts only using an unbiased methodology and our articles are not intended to be financial advice. It does not constitute a recommendation to buy or sell any stock, and does not take account of your objectives, or your financial situation. We aim to bring you long-term focused analysis driven by fundamental data. Note that our analysis may not factor in the latest price-sensitive company announcements or qualitative material. Simply Wall St has no position in any stocks mentioned.