Does Peloton’s Major Product Relaunch Signal a Turning Point for Its 2025 Valuation?
Peloton Interactive PTON | 4.30 | +0.23% |
If you are scratching your head over what to do with Peloton Interactive stock right now, join the club. With shares closing most recently at $7.34, and a value score of 2 out of 6 for undervaluation, it is clear the market has some mixed feelings. Over the past year, Peloton has managed a surprising rebound, climbing 55.5%. Yet, zooming out over the last five years tells a starkly different story, with shares tumbling by a jaw-dropping 94.4%. This serves as a reminder of how swiftly sentiment can shift in the world of connected fitness.
What is causing the current uncertainty? Part of it comes down to recent price swings. In just the last week, shares slipped by 15.3%, and they are down nearly 17% so far this year. Still, that one-year jump suggests investors are hungry for any hints of a turnaround. Much of the buzz centers on Peloton’s big product relaunches, such as updated bikes, new commercial equipment, and a pivot towards AI-powered features. The company is clearly betting that fresh technology and a sharper commercial push can reset growth expectations and improve risk perceptions, especially ahead of the all-crucial holiday season.
But do these changes make Peloton undervalued today? With a value score of just 2, meaning it only passes two of six major undervaluation checks, the debate is far from settled. Up next, we will break down how Peloton stacks up across several key valuation approaches. And stick around, because at the end, we will dig into an even more insightful way to assess the company’s true worth.
Peloton Interactive scores just 2/6 on our valuation checks. See what other red flags we found in the full valuation breakdown.
Approach 1: Peloton Interactive Discounted Cash Flow (DCF) Analysis
A Discounted Cash Flow (DCF) model estimates a company’s intrinsic value by projecting its future cash flows and discounting them back to today’s value. This approach aims to capture how much all expected future cash generated by the business is worth in present terms.
For Peloton Interactive, the model uses a 2 Stage Free Cash Flow to Equity method. The company’s latest trailing twelve month free cash flow stands at $298.3 million. Analysts have forecast Peloton’s annual free cash flow to grow in the coming years, with projections reaching $440.7 million by 2030. The estimates for the latter portion of this period are extrapolated by Simply Wall St beyond the initial five years of analyst coverage.
Based on these projections, the intrinsic value for Peloton stock is calculated at $17.80 per share. Since the market price is $7.34, this implies the stock trades at a substantial 58.8% discount to its projected fair value using the DCF approach. In valuation terms, this is a bullish gap.
Result: UNDERVALUED
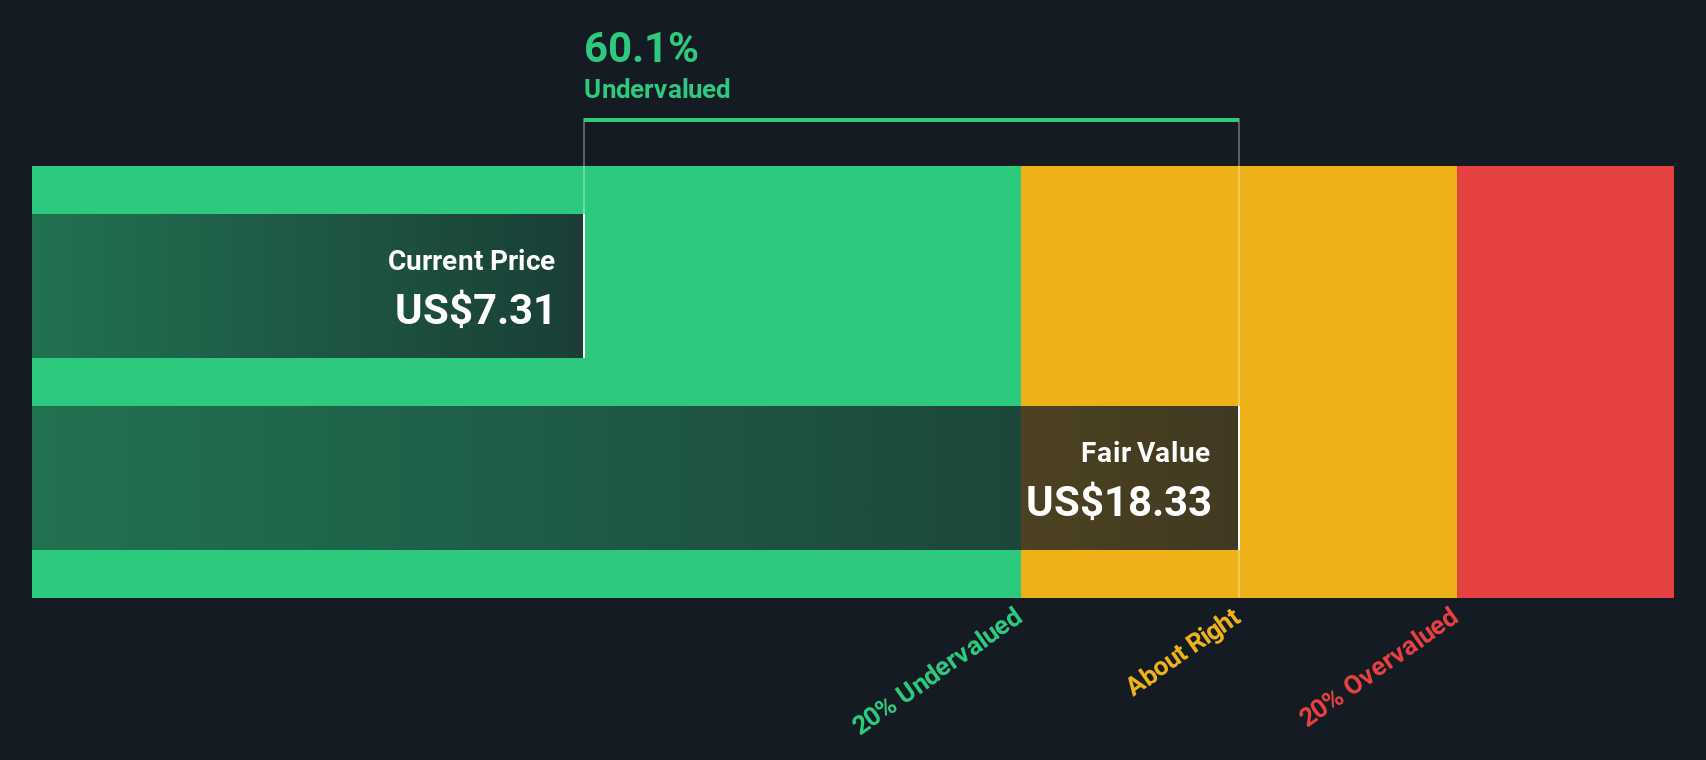
Our Discounted Cash Flow (DCF) analysis suggests Peloton Interactive is undervalued by 58.8%. Track this in your watchlist or portfolio, or discover more undervalued stocks.
Approach 2: Peloton Interactive Price vs Sales
For companies that have yet to report consistent profits, especially those focused on expansion and market share, the Price-to-Sales (P/S) ratio is a reliable valuation tool. It looks past near-term earnings volatility and instead measures how much investors are willing to pay for every dollar of Peloton’s revenue. This is a relevant lens given Peloton’s current focus on growth and eventual profitability.
Growth expectations and risk levels play a big role in shaping what a "normal" or acceptable P/S ratio should look like. Higher growth prospects usually justify a premium multiple, while companies facing substantial risks or market headwinds tend to trade at discounted ratios. Comparing ratios across companies in the same industry can paint a clearer picture, but does not always capture company-specific factors.
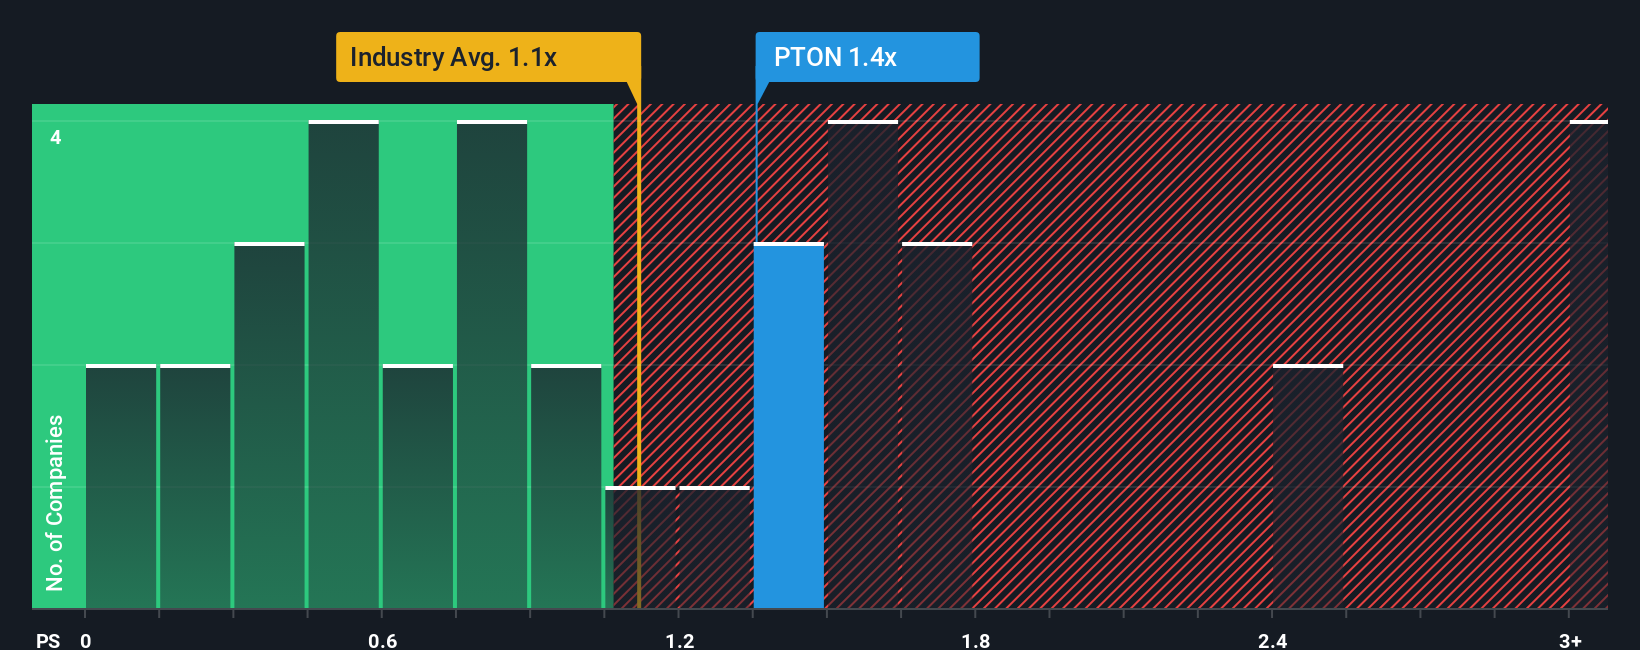
Currently, Peloton trades at a P/S ratio of 1.20x. This sits just above the industry average of 1.04x and is quite close to the peer average of 1.19x. However, Simply Wall St’s proprietary “Fair Ratio” places Peloton’s justified P/S at 1.14x. The Fair Ratio goes beyond a simple industry average and factors in the company’s revenue growth, risks, profit margin, and market size for a more realistic benchmark.
While Peloton's P/S is a touch above its Fair Ratio, the difference is marginal. This suggests the stock’s price is valuing the business about right given its current position and outlook according to this method.
Result: ABOUT RIGHT
PS ratios tell one story, but what if the real opportunity lies elsewhere? Discover companies where insiders are betting big on explosive growth.
Upgrade Your Decision Making: Choose your Peloton Interactive Narrative
Earlier, we mentioned there is an even better way to understand valuation. Let us introduce you to Narratives, an approach that brings the company story front and center and links it directly to a financial forecast and fair value.
A Narrative is simply your perspective on how Peloton’s story will play out, describing what you believe will shape its future, alongside your own estimates for things like revenue, profit margins, and future share price. By building a Narrative, you connect the dots between Peloton's business developments, the numbers you expect to see, and the price you think the stock is really worth.
Best of all, Narratives are accessible for everyone on Simply Wall St’s popular Community page, where millions of investors share, compare, and challenge each other’s stories and assumptions. Narratives update dynamically as new news or earnings are released, so your view can evolve alongside Peloton.
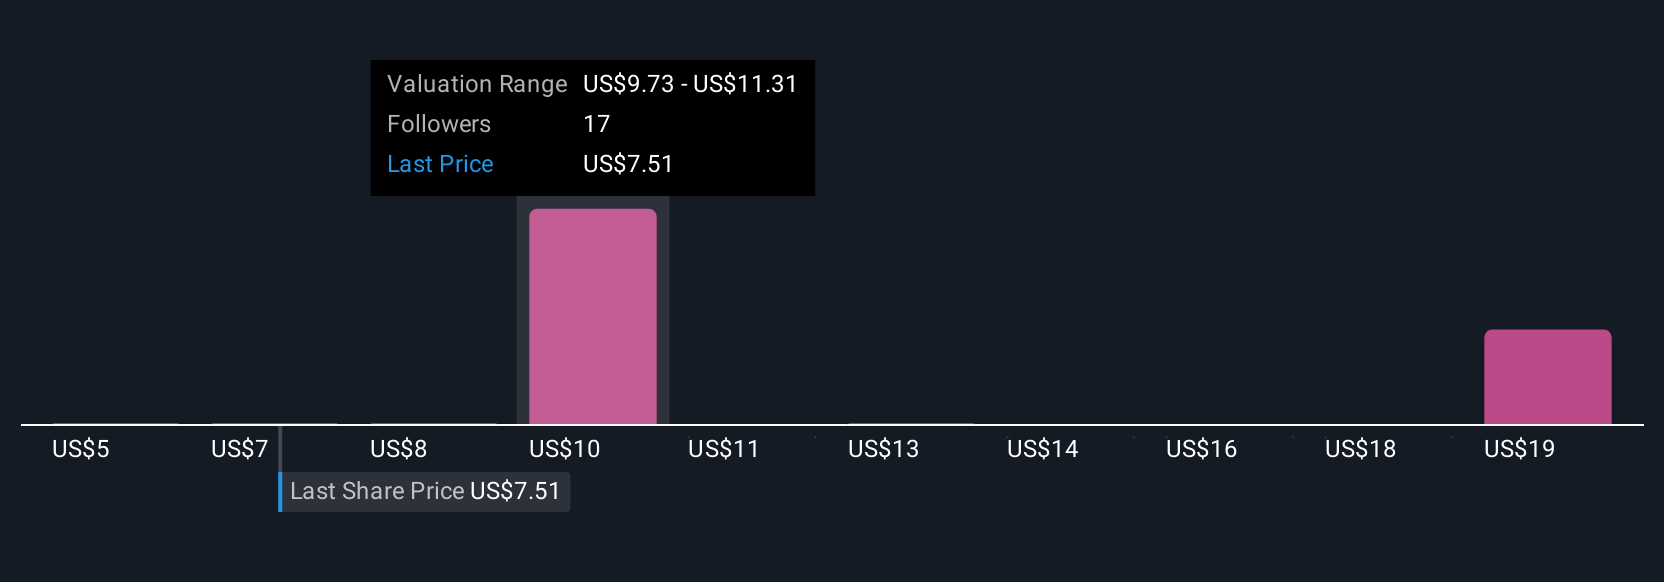
Using this tool, you can instantly see whether your forecast and fair value suggest Peloton is a buy or a sell at today’s price. For example, one Narrative sees Peloton expanding into holistic wellness and boosting profits, with a price target as high as $20. A cautionary take focuses on ongoing competition and declining subscriptions, pointing to a target as low as $5.
Do you think there's more to the story for Peloton Interactive? Create your own Narrative to let the Community know!
This article by Simply Wall St is general in nature. We provide commentary based on historical data and analyst forecasts only using an unbiased methodology and our articles are not intended to be financial advice. It does not constitute a recommendation to buy or sell any stock, and does not take account of your objectives, or your financial situation. We aim to bring you long-term focused analysis driven by fundamental data. Note that our analysis may not factor in the latest price-sensitive company announcements or qualitative material. Simply Wall St has no position in any stocks mentioned.