

Does Strong Q2 2026 Results And Higher Dividend Payout Change The Bull Case For Williams (WMB)?
Williams Companies, Inc. WMB | 0.00 |
- Williams Companies recently reported past Q2 2026 results, with revenue rising to US$3,053 million and net income to US$827 million, alongside higher earnings per share versus a year earlier.
- At the same time, the board approved a 5% increase in the regular quarterly dividend to US$0.525 per share, underscoring management’s confidence in the company’s cash generation.
- We’ll now examine how stronger year-on-year earnings, alongside a higher dividend, influence Williams Companies’ existing investment narrative and risk profile.
Invest in the nuclear renaissance through our list of 89 elite nuclear energy infrastructure plays powering the global AI revolution.
Williams Companies Investment Narrative Recap
To own Williams Companies, you need to believe in the long-term role of US natural gas infrastructure and the company’s ability to keep its pipes full and cash flows resilient. The latest Q2 2026 results, with higher revenue and net income, support that case in the near term, even though the key short term catalyst remains execution on pipeline and power-related projects, while the biggest risk continues to be long-term energy transition and policy shifts. The new data does not materially change those core drivers.
The 5% dividend increase to US$0.525 per share ties directly into the earnings story, because it relies on Williams’ confidence in cash generation from its existing network and project backlog. For investors focused on income, this higher payout is an important piece of the thesis that Williams can balance heavy capital spending with returning cash to shareholders, though it also raises the stakes if future permitting or decarbonization policies were to slow volume growth across its system.
Yet investors should be aware that if policy or technology shifts faster than expected, Williams’ large, long life pipeline assets could...
Williams Companies’ narrative projects $15.6 billion revenue and $3.9 billion earnings by 2029. This requires 8.8% yearly revenue growth and about a $1.1 billion earnings increase from $2.8 billion.
Uncover how Williams Companies' forecasts yield a $83.55 fair value, a 16% upside to its current price.
Exploring Other Perspectives
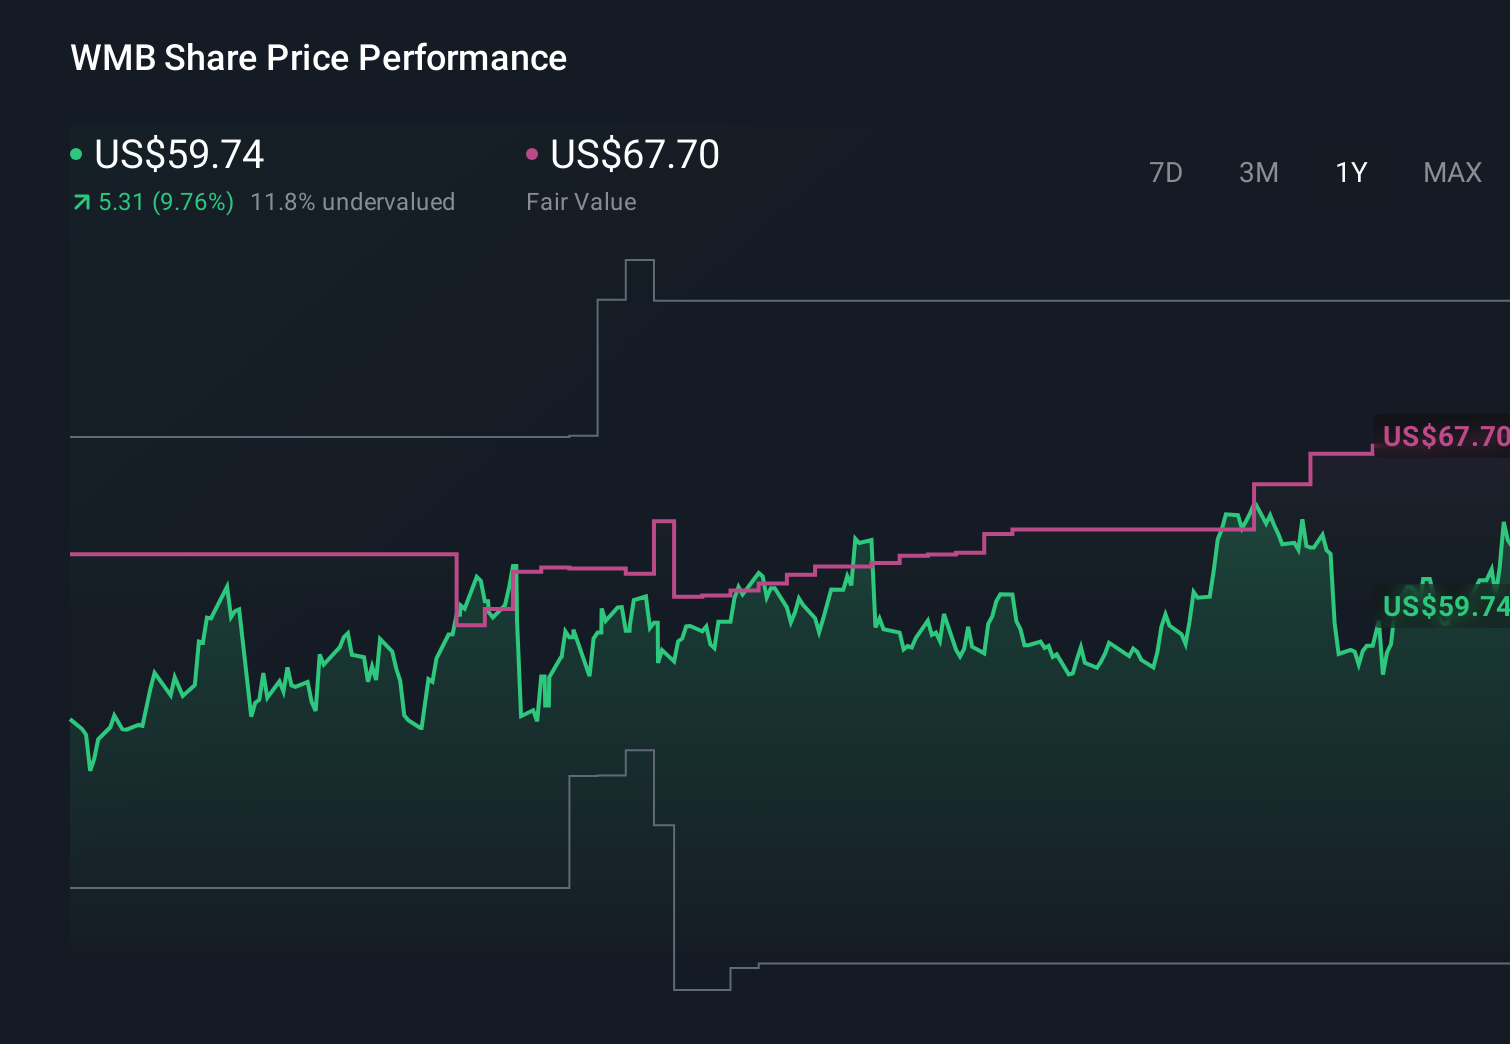
Some of the most optimistic analysts were already assuming revenue could reach about US$17.9 billion and earnings US$4.8 billion by 2029, so when you look at Q2’s stronger results in light of those higher expectations and the added pressure from rising ESG scrutiny, it shows how differently people can see the same stock and why it is worth comparing several viewpoints before deciding what you believe.
Explore 5 other fair value estimates on Williams Companies - why the stock might be worth just $71.03!
Decide For Yourself
Don't just follow the ticker - dig into the data and build a conviction that's truly your own.
- A great starting point for your Williams Companies research is our analysis highlighting 3 key rewards and 3 important warning signs that could impact your investment decision.
- Our free Williams Companies research report provides a comprehensive fundamental analysis summarized in a single visual - the Snowflake - making it easy to evaluate Williams Companies' overall financial health at a glance.
Interested In Other Possibilities?
Our top stock finds are flying under the radar-for now. Get in early:
- Uncover the next big thing with 20 elite penny stocks that balance risk and reward.
- AI is about to change healthcare. These 42 stocks are working on everything from early diagnostics to drug discovery. The best part - they are all under $10b in market cap - there's still time to get in early.
- Capitalize on the AI infrastructure supercycle with our selection of the 55 best 'picks and shovels' of the AI gold rush converting record-breaking demand into massive cash flow.
This article by Simply Wall St is general in nature. We provide commentary based on historical data and analyst forecasts only using an unbiased methodology and our articles are not intended to be financial advice. It does not constitute a recommendation to buy or sell any stock, and does not take account of your objectives, or your financial situation. We aim to bring you long-term focused analysis driven by fundamental data. Note that our analysis may not factor in the latest price-sensitive company announcements or qualitative material. Simply Wall St has no position in any stocks mentioned.