

Does Stronger EPS And Lower Charge-Offs Change The Bull Case For CNB Financial (CCNE)?
CNB Financial Corporation CCNE | 0.00 |
- CNB Financial Corporation reported past second-quarter and first-half 2026 results showing net interest income of US$76.34 million and US$149.67 million, and net income of US$28.30 million and US$55.34 million, respectively, alongside lower net loan charge-offs compared with a year earlier.
- This combination of higher earnings per share from continuing operations and reduced credit losses points to improved profitability and credit quality within the bank’s core lending operations.
- With earnings per share increasing alongside lower net loan charge-offs, we’ll now examine how this shapes CNB Financial’s investment narrative.
AI is about to change healthcare. These 42 stocks are working on everything from early diagnostics to drug discovery. The best part - they are all under $10b in market cap - there's still time to get in early.
What Is CNB Financial's Investment Narrative?
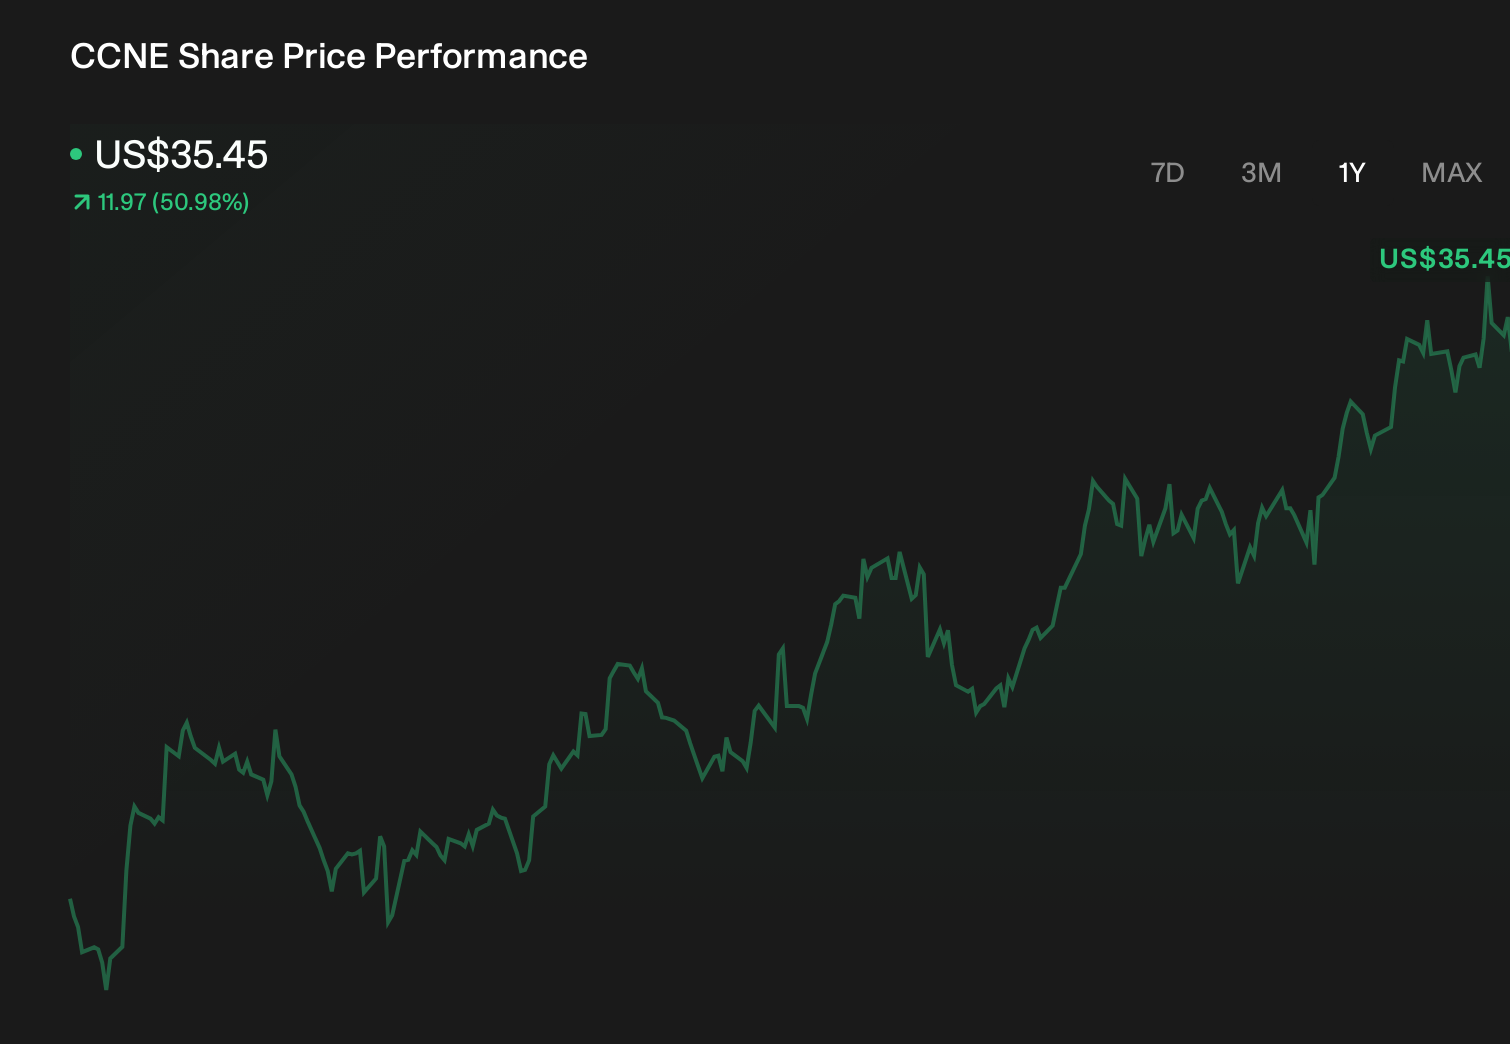
For CNB Financial, the core belief you’d need as a shareholder is that a steadily profitable regional bank with improving credit metrics can keep compounding value without relying on rapid growth. The latest quarter, with higher net interest income, stronger earnings per share from continuing operations and materially lower net loan charge-offs, reinforces that story by showing better profitability and cleaner credit costs at the same time. In the short term, the key catalysts remain management’s capital deployment choices, including the buyback authorization and ongoing dividends, as well as execution following its recent index inclusion and balance sheet moves like the subordinated notes redemption. The recent results mostly strengthen, rather than change, these drivers, while trimming some near term credit risk without removing the usual banking-cycle uncertainties.
However, one specific credit-related risk may matter much more than it first appears. Our valuation report here indicates CNB Financial may be undervalued.Exploring Other Perspectives
Explore 3 other fair value estimates on CNB Financial - why the stock might be worth just $37.25!
Decide For Yourself
Don't just follow the ticker - dig into the data and build a conviction that's truly your own.
- A great starting point for your CNB Financial research is our analysis highlighting 5 key rewards and 1 important warning sign that could impact your investment decision.
- Our free CNB Financial research report provides a comprehensive fundamental analysis summarized in a single visual - the Snowflake - making it easy to evaluate CNB Financial's overall financial health at a glance.
Want Some Alternatives?
Every day counts. These free picks are already gaining attention. See them before the crowd does:
- The future of work is here. Discover the 36 top robotics and automation stocks leading the charge in AI-driven automation and industrial transformation.
- Uncover the next big thing with 19 elite penny stocks that balance risk and reward.
- Invest in the nuclear renaissance through our list of 89 elite nuclear energy infrastructure plays powering the global AI revolution.
This article by Simply Wall St is general in nature. We provide commentary based on historical data and analyst forecasts only using an unbiased methodology and our articles are not intended to be financial advice. It does not constitute a recommendation to buy or sell any stock, and does not take account of your objectives, or your financial situation. We aim to bring you long-term focused analysis driven by fundamental data. Note that our analysis may not factor in the latest price-sensitive company announcements or qualitative material. Simply Wall St has no position in any stocks mentioned.