Does Talen Energy’s 93% Rally Reflect Real Value After Early 2025 Earnings Surprise?
Talen Energy Corp TLN | 327.88 | +2.71% |
Trying to figure out what to do with Talen Energy stock? You are in good company. This ticker has caught serious attention lately, especially considering its enormous 93.8% gain year-to-date and a whopping 125.7% climb over the last year. Sure, there was a minor dip of 2.9% in the last week, but zooming out to a 30-day view reveals a robust 7.8% jump. Such moves are rare outside of truly transformative periods. In Talen's case, recent shifts in the clean energy market and investor appetite for utilities seem to be playing a big part.
But as always, the key question is, how should you value this kind of momentum? Talen lists a value score of 2 out of 6, which means it's only passing two of the major undervaluation checks analysts often look for. That is by no means a knockout bargain, but it's also a sign that something interesting might be lurking beneath the headlines.
In the next section, we will break down what goes into that value score and examine how Talen stacks up on different valuation metrics. And for those searching for an edge, stick around, because we will also explore one approach that can offer even deeper insight into whether Talen is really undervalued or if the market already knows the score.
Talen Energy scores just 2/6 on our valuation checks. See what other red flags we found in the full valuation breakdown.Approach 1: Talen Energy Discounted Cash Flow (DCF) Analysis
The Discounted Cash Flow (DCF) model estimates a company’s true value by projecting its future cash flows and discounting them back to today's value. This approach helps investors look past current market sentiment and assess what a business might really be worth based on expected future performance.
For Talen Energy, the current annual Free Cash Flow (FCF) stands at -$211.8 Million. Looking ahead, analysts forecast significant improvements, projecting FCF to rise to $1.88 Billion by 2029. While most estimates only extend five years, Simply Wall St extends these forecasts for a full decade, showing FCF potentially surpassing $2.8 Billion by 2035.
These projections feed into the DCF calculation, resulting in an estimated intrinsic value of $1,008.97 per share. Based on the model, Talen Energy's stock trades at a 59.2% discount to this intrinsic value, suggesting the shares are substantially undervalued at current prices.
Result: UNDERVALUED
Head to the Valuation section of our Company Report for more details on how we arrive at this Fair Value for Talen Energy.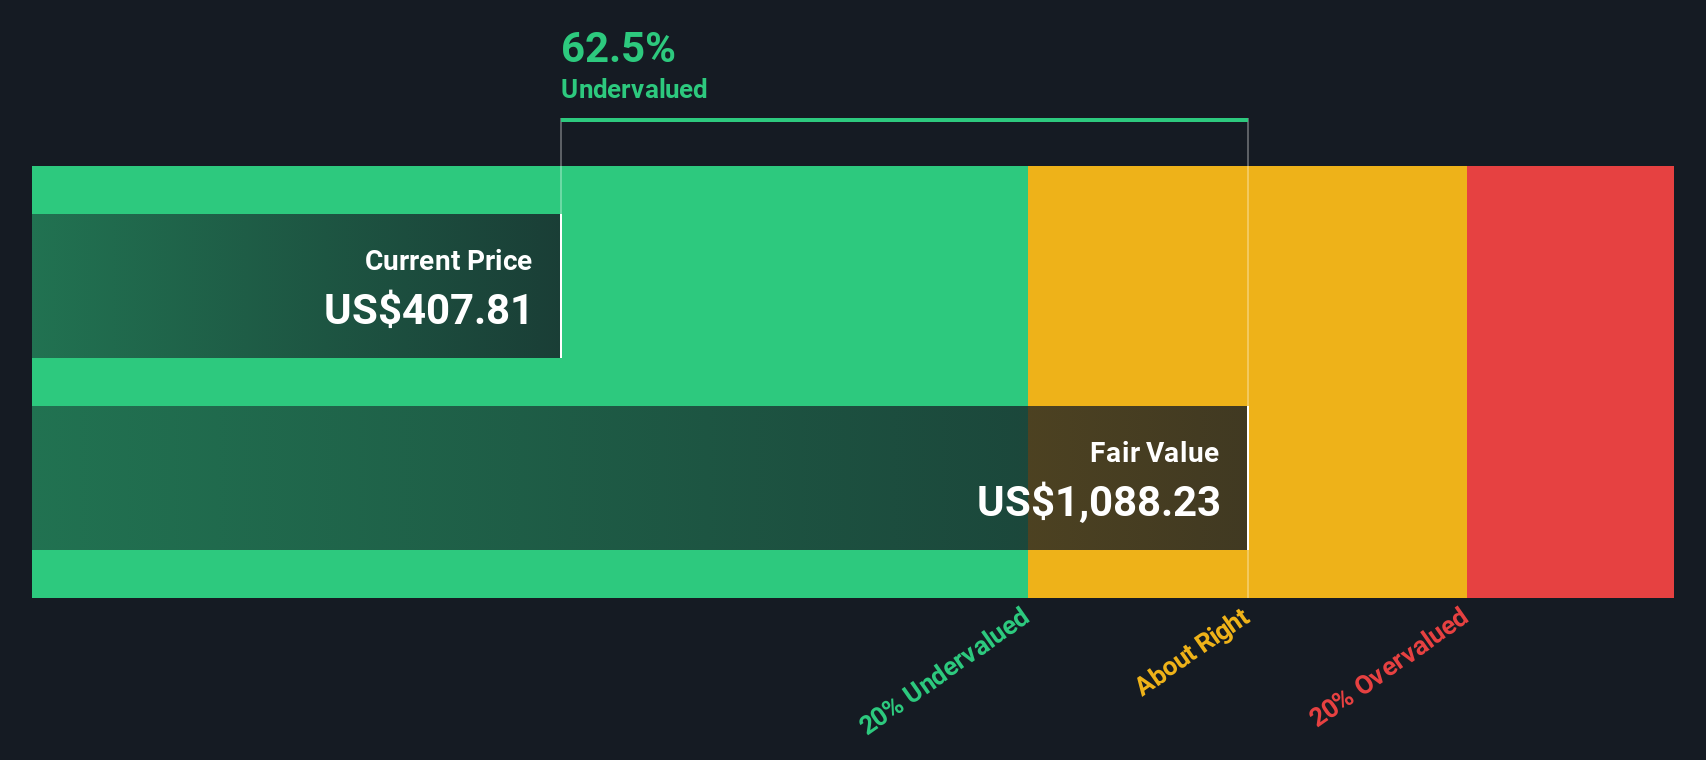
Approach 2: Talen Energy Price vs Earnings
The Price-to-Earnings (PE) ratio is the preferred valuation metric when a company is generating profits, as it shows how much investors are willing to pay for each dollar of earnings. A higher PE can be justified by strong growth expectations or lower risk. Lower PEs typically reflect uncertainty or limited growth potential.
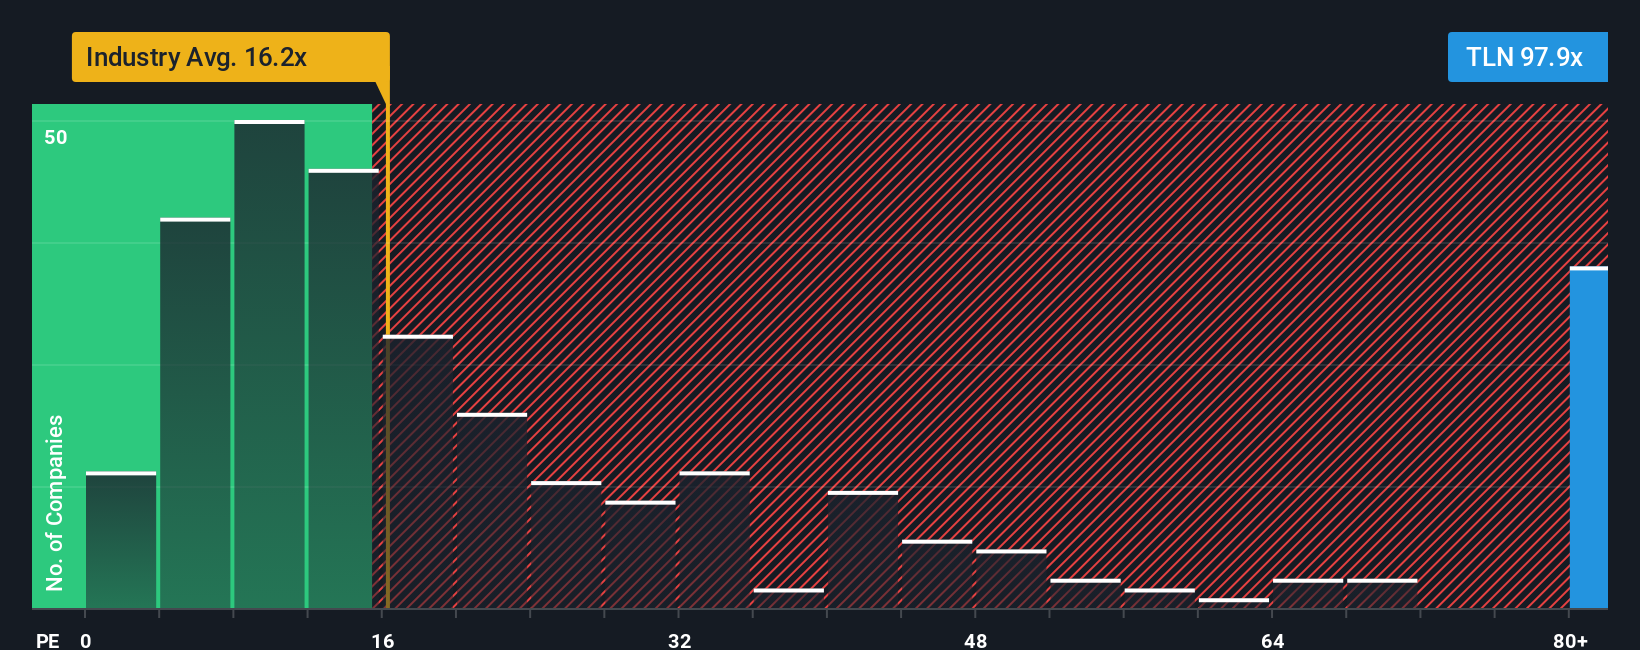
Currently, Talen Energy trades at a PE ratio of 100.5x. This stands far above both the renewable energy industry average of 16.0x and the average of its closest peers at 21.5x. At a glance, this lofty multiple suggests the market expects significant future growth from Talen, or is factoring in other unique company traits that make its earnings more valuable.
However, Simply Wall St’s “Fair Ratio” provides a more nuanced take by calculating what PE multiple would be justified for Talen based on its specific growth outlook, profitability, industry, market cap, and risk factors. For Talen, the Fair Ratio is 68.0x, substantially higher than the sector average but notably below the actual market multiple. This approach offers a more precise benchmark than comparing to industry peers alone, as it accounts for what makes Talen unique.
In summary, with Talen trading at 100.5x earnings against a Fair Ratio of 68.0x, the stock appears to be overvalued on this measure.
Result: OVERVALUED
Upgrade Your Decision Making: Choose your Talen Energy Narrative
Earlier we mentioned that there is an even better way to understand valuation, so let’s introduce you to Narratives. A Narrative is simply the story behind a company: your view of its future prospects, supported by your own estimates for revenue, profit margins, and fair value. Instead of only reviewing what the numbers say, Narratives connect the dots between the company’s unique business situation, your personal forecast, and what you believe the stock is really worth.
This approach is accessible to all investors on Simply Wall St’s Community page and lets you put your opinion into action. By overlaying your forecast onto the latest data, you can compare your fair value with the share price and quickly spot if the market is missing something important or if the current price already reflects your outlook.
Narratives adapt in real-time whenever news or earnings are released, keeping your view automatically up to date. For example, some Talen Energy investors build a bullish Narrative with a price target of $450.0, projecting rapid growth from new contracts and grid modernization. Others are more cautious, forecasting just $307.0 and focusing on risks from fossil fuel exposure or policy changes. Narratives empower you to invest with conviction, on your terms.
Do you think there's more to the story for Talen Energy? Create your own Narrative to let the Community know!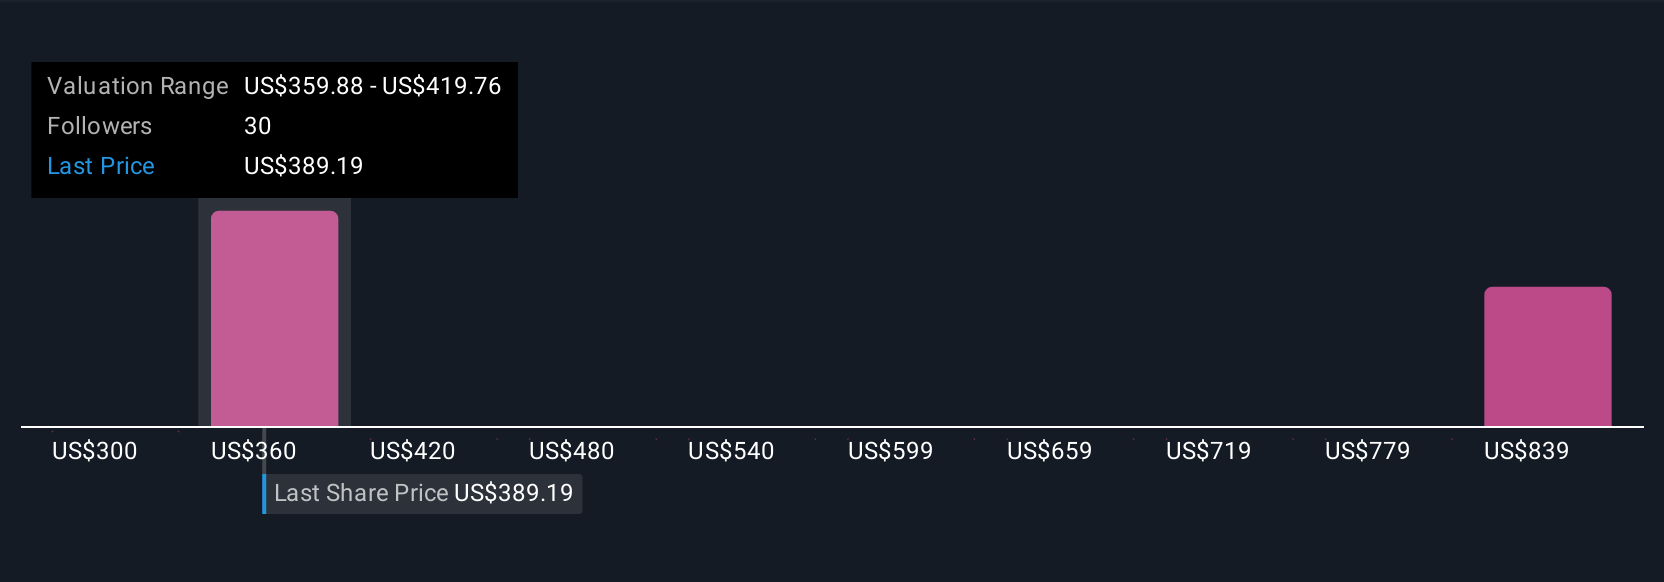
This article by Simply Wall St is general in nature. We provide commentary based on historical data and analyst forecasts only using an unbiased methodology and our articles are not intended to be financial advice. It does not constitute a recommendation to buy or sell any stock, and does not take account of your objectives, or your financial situation. We aim to bring you long-term focused analysis driven by fundamental data. Note that our analysis may not factor in the latest price-sensitive company announcements or qualitative material. Simply Wall St has no position in any stocks mentioned.