Does the Recent 8.6% Drop Signal a New Opportunity in SailPoint?
SailPoint, Inc. SAIL | 13.36 13.36 | +0.91% 0.00% Post |
- Ever wondered if SailPoint is genuinely undervalued or if the buzz is outpacing the stock's real worth? You're not alone. We are diving into what those headline numbers might be hiding.
- SailPoint's stock has recently slipped, dropping 5.7% in the last week and 8.6% over the last month. This has raised fresh questions about risk and future growth potential.
- Recent news has centered on industry-wide cybersecurity concerns and shifting investor sentiment toward digital identity management stocks. While SailPoint has not been at the center of a major news event, these broader trends are clearly impacting its market movements.
- On our valuation scale, SailPoint scores just 1 out of 6 for being undervalued, which suggests there may be better opportunities elsewhere. Next, we will break down how this score is determined using different valuation methods. Stick around, because by the end of the article, you will learn a smarter way to put a value on SailPoint’s story.
SailPoint scores just 1/6 on our valuation checks. See what other red flags we found in the full valuation breakdown.
Approach 1: SailPoint Discounted Cash Flow (DCF) Analysis
A Discounted Cash Flow (DCF) model estimates the value of a company by projecting its future cash flows and discounting them back to today's dollars. This provides an intrinsic value based on expected performance rather than current market mood.
For SailPoint, the model starts with a current Free Cash Flow (FCF) of -$58 million. While this negative cash flow is a concern, projections anticipate rapid improvement. By 2028, analysts forecast the company could generate $253.63 million in annual FCF. Further estimates suggest this could grow to $464.30 million by 2035. The initial five-year projections are informed by analyst forecasts, and the longer-term outlook is derived from Simply Wall St extrapolations.
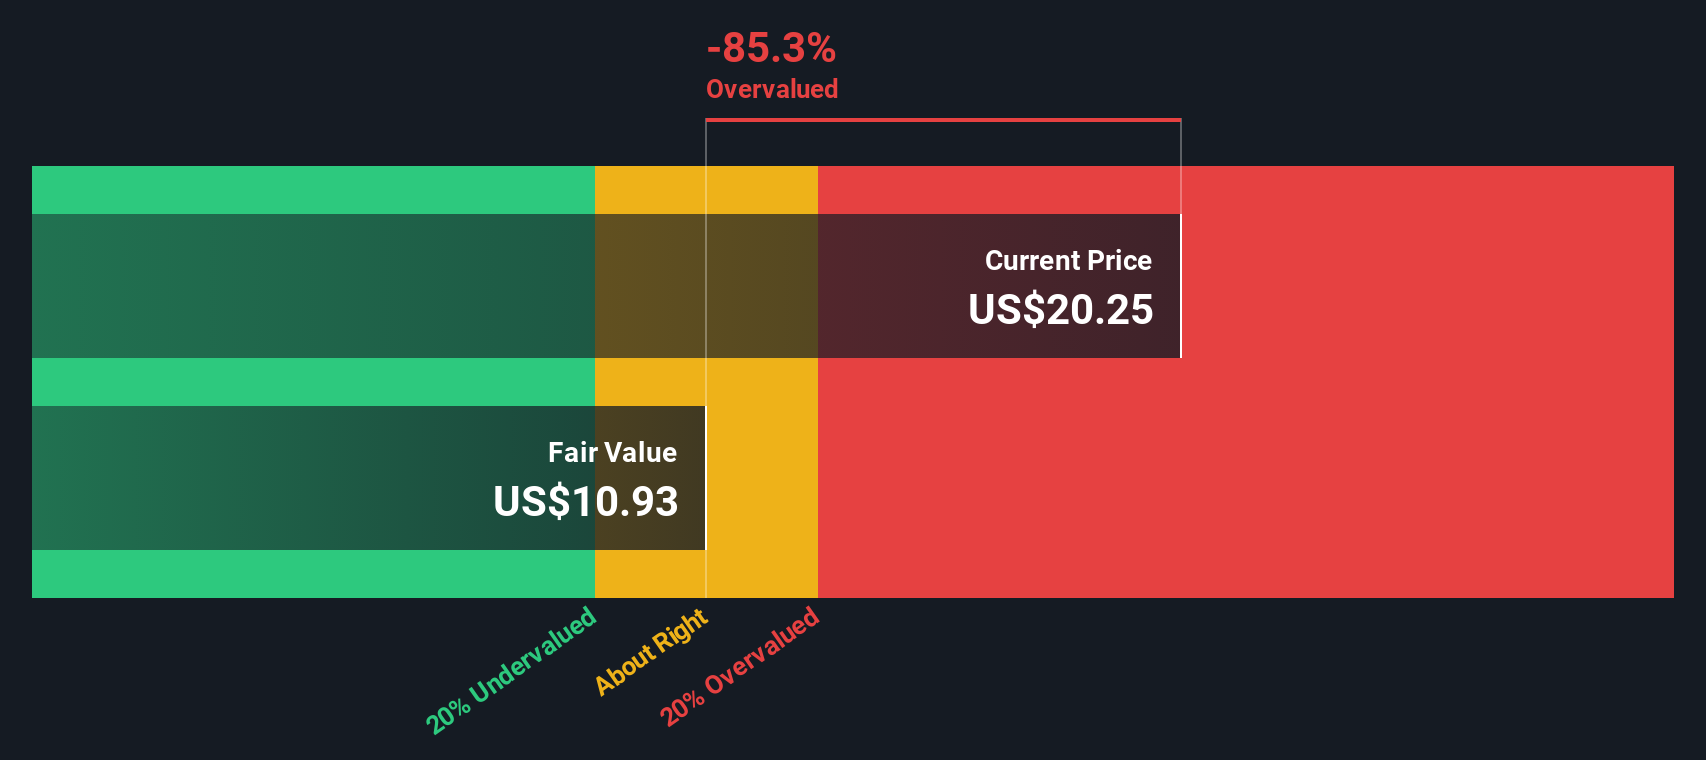
After discounting all these expected cash flows back to present day, the DCF valuation results in an intrinsic value of $10.64 per share. Compared with the current share price, this implies SailPoint is 101.9% overvalued using this approach. In short, the market is pricing in far more optimism than the long-term cash flow story supports.
Result: OVERVALUED
Our Discounted Cash Flow (DCF) analysis suggests SailPoint may be overvalued by 101.9%. Discover 843 undervalued stocks or create your own screener to find better value opportunities.
Approach 2: SailPoint Price vs Sales
For companies like SailPoint where earnings are negative but revenue growth is strong, the Price-to-Sales (P/S) ratio becomes the preferred valuation metric. This is because sales figures are less volatile than earnings for unprofitable or newly profitable tech firms, making P/S a useful tool for comparing companies with similar business models and growth phases.
The "right" P/S ratio for any software company depends on several factors, including how quickly it is growing and the risks it faces. Fast-growing, innovative companies are generally rewarded with higher multiples, while slower growth or extra risk pulls those valuations back down.
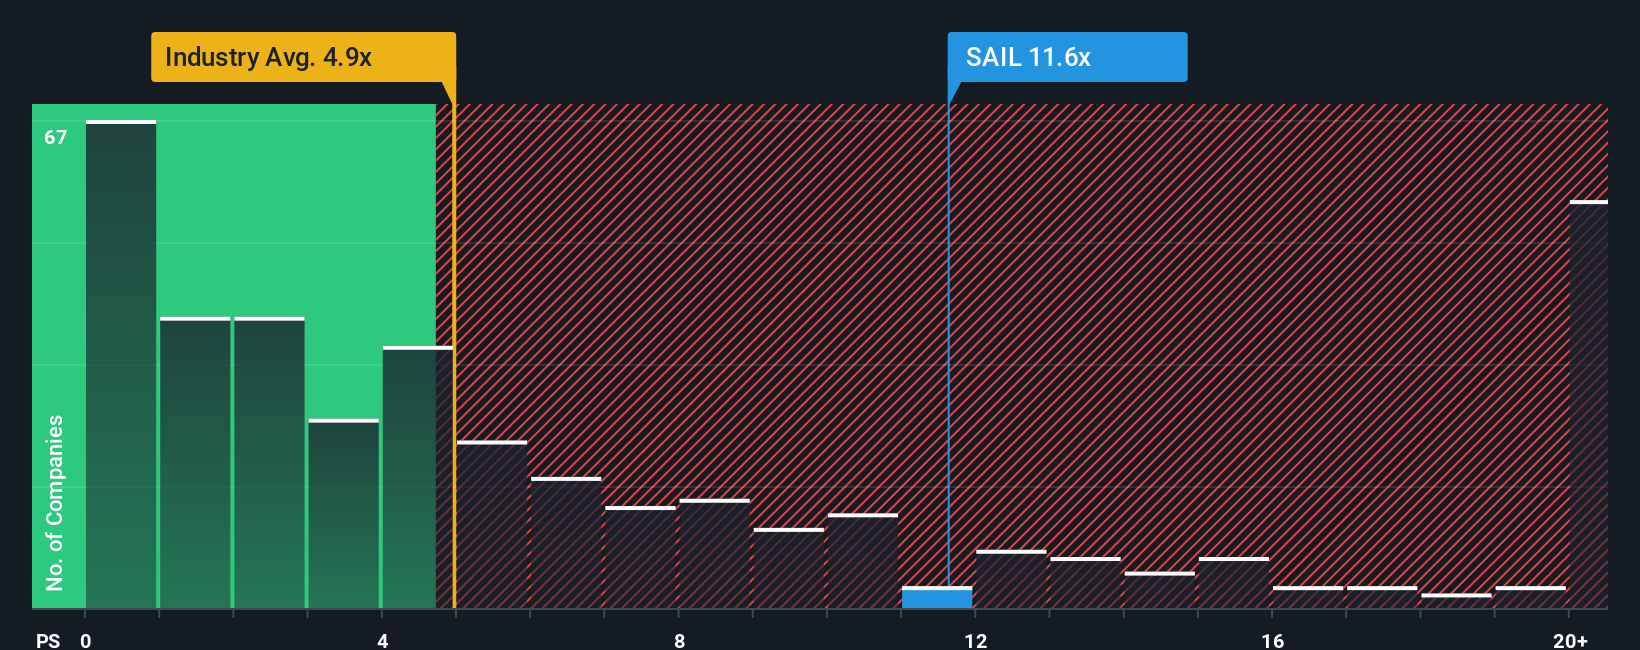
SailPoint currently trades at a P/S ratio of 12.33x. This is notably higher than the peer average of 7.55x and more than double the Software industry mean of 5.25x. However, Simply Wall St’s proprietary "Fair Ratio" model, an advanced metric considering SailPoint’s unique growth prospects, profit margins, industry trends, market cap, and company-specific risks, puts the fair P/S ratio at 8.18x.
Compared to peers and the industry, the Fair Ratio provides a more holistic benchmark. It avoids the pitfalls of simple averages by calibrating for SailPoint’s particular strengths and risk profile. This gives investors a clearer sense of whether the current premium is actually justified by the company’s fundamentals.
With SailPoint’s actual P/S multiple well above its Fair Ratio, the stock appears overvalued on this basis.
Result: OVERVALUED
PS ratios tell one story, but what if the real opportunity lies elsewhere? Discover 1410 companies where insiders are betting big on explosive growth.
Upgrade Your Decision Making: Choose your SailPoint Narrative
Earlier we mentioned that there's an even better way to understand valuation, so let's introduce you to Narratives. A Narrative is a simple yet powerful investment tool that lets you create a story behind the numbers, blending your assumptions about SailPoint’s future revenue, earnings, and profit margins into a personal financial forecast and fair value estimate.
With Narratives, you are not just looking at dry numbers. Instead, you’re connecting SailPoint’s story to real, dynamic outcomes, making your investment strategy more intuitive and informed. Narratives are available right now in the Community page on Simply Wall St, used by millions of investors to quickly see, compare and update their own forecasts.
The real advantage is that Narratives help you decide when to buy or sell by showing you how your fair value stacks up against the current price. And because Narratives update automatically when big news or new earnings data drops, you always have a living picture of SailPoint’s outlook.
For example, some investors currently have a high fair value for SailPoint based on rapid market expansion, while others set a much lower fair value because they see more risk and slower growth ahead. This showcases how Narratives reflect a range of perspectives in real time.
Do you think there's more to the story for SailPoint? Head over to our Community to see what others are saying!

This article by Simply Wall St is general in nature. We provide commentary based on historical data and analyst forecasts only using an unbiased methodology and our articles are not intended to be financial advice. It does not constitute a recommendation to buy or sell any stock, and does not take account of your objectives, or your financial situation. We aim to bring you long-term focused analysis driven by fundamental data. Note that our analysis may not factor in the latest price-sensitive company announcements or qualitative material. Simply Wall St has no position in any stocks mentioned.