Energy Services Of America (ESOA) Q1 EPS Rebound Tests Concerns Over 0.5% Trailing Margin
Energy Services of America Corporation ESOA | 14.60 | +1.11% |
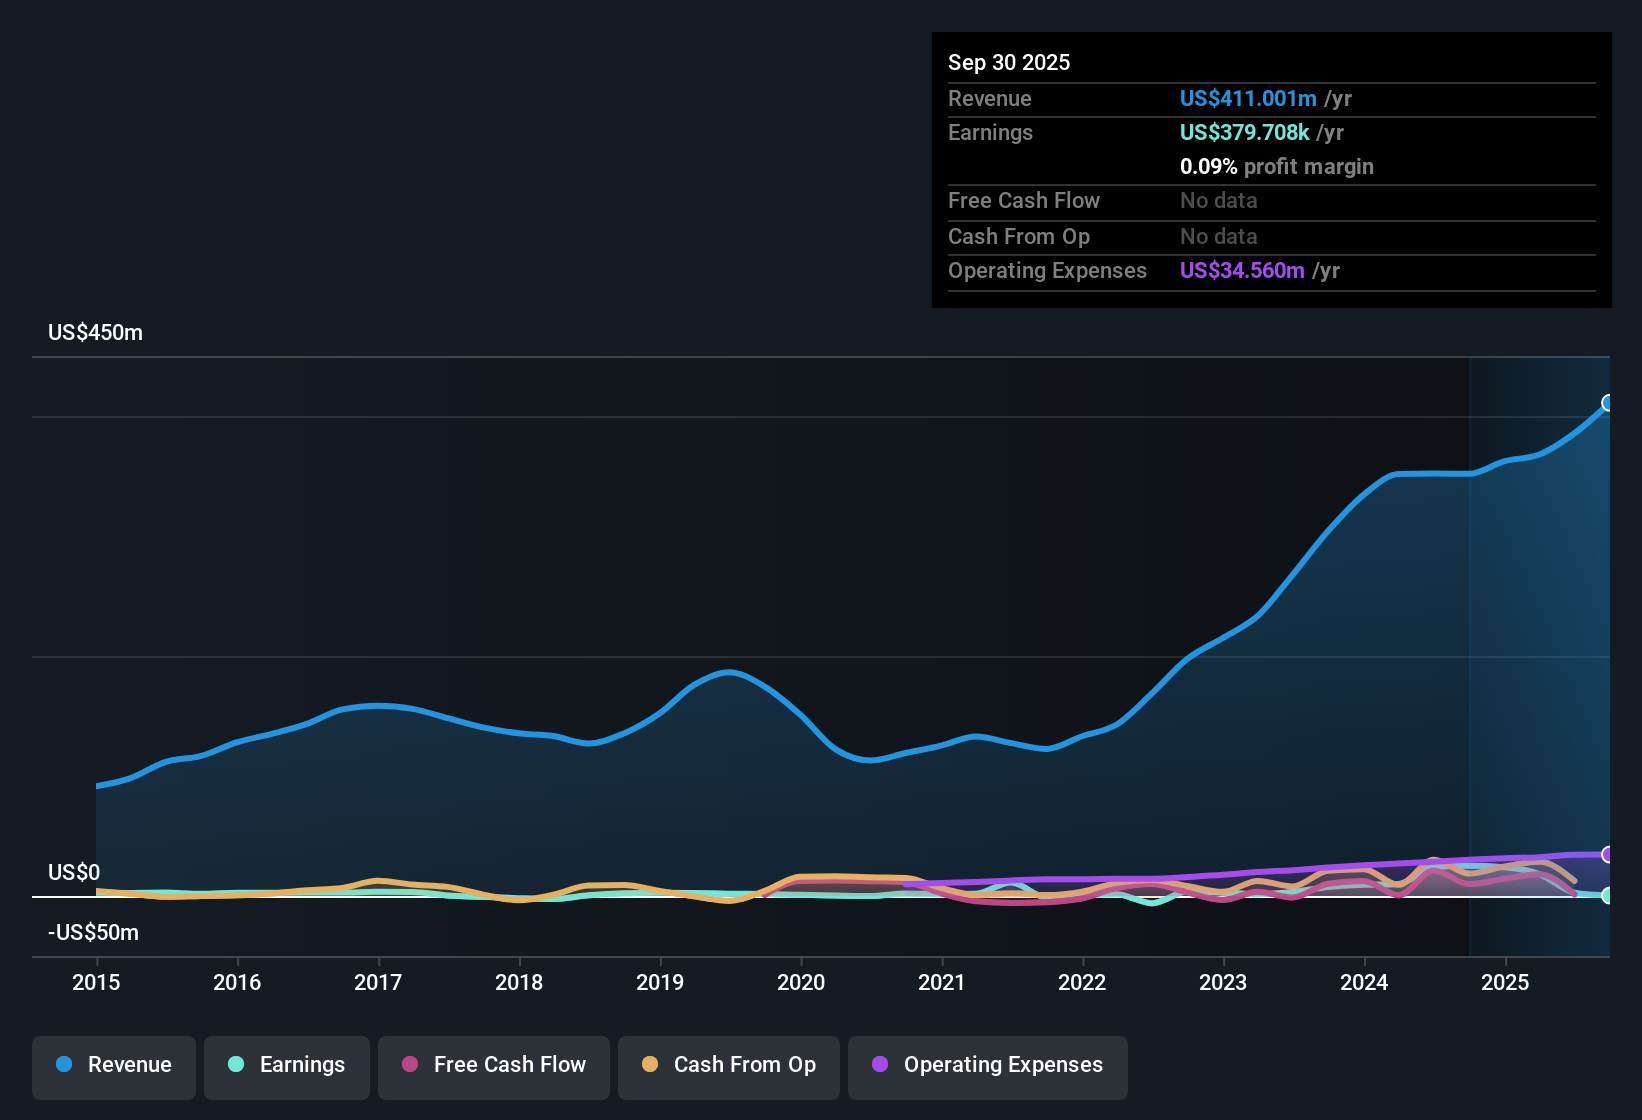
Energy Services of America (ESOA) has kicked off Q1 2026 with revenue of about US$114.1 million and basic EPS of roughly US$0.16, backed by net income of around US$2.7 million for the quarter. The company has seen quarterly revenue move from about US$100.6 million in Q1 2025 to US$130.1 million in Q4 2025 and then to US$114.1 million in Q1 2026, while EPS shifted from roughly US$0.05 in Q1 2025 to US$0.26 in Q4 2025 and US$0.16 in the latest quarter. This sets up a results season in which investors may focus more on profitability quality and margin resilience than on headline growth.
See our full analysis for Energy Services of America.With the fresh numbers on the table, the next step is to see how this earnings profile lines up against the widely followed growth, risk, and valuation narratives around ESOA.
Margins Thin With 0.5% Trailing Net Margin
- Over the last 12 months, ESOA’s trailing net profit margin sits at 0.5%, compared with 6.6% a year earlier, even though trailing revenue is about US$424.5 million and net income is roughly US$2.2 million.
- Bears point to this margin pressure as a key weakness, and the data backs up that concern with:
- Q1 2026 net income of about US$2.7 million on revenue of roughly US$114.1 million, which lines up with the slim trailing margin rather than the 6.6% level seen a year ago.
- Trailing net income of around US$2.2 million against US$424.5 million of revenue, showing that most of the top line is being absorbed by costs before reaching the bottom line.
P/E Of 94.5x Versus High DCF Fair Value
- ESOA trades on a P/E of 94.5x, compared with peer and US Energy Services industry averages in the mid 20s, while the current share price of US$12.68 sits well below the stated DCF fair value of about US$33.79.
- What is interesting for a more bullish angle is how these valuation signals pull in different directions:
- The high 94.5x P/E suggests the market price is rich relative to recent earnings, especially as trailing net income over the last year is about US$2.2 million.
- At the same time, the DCF fair value of roughly US$33.79 is about 62.5% above the current US$12.68 price, which aligns with the idea that longer term cash flow expectations could be more generous than what trailing profits alone might suggest.
Interest Coverage Weak Despite Earnings Recovery
- Over the last 12 months, earnings have not been sufficient to comfortably cover interest payments, and that sits alongside trailing net profit margin of 0.5% and a P/E of 94.5x.
- Critics highlight this as a central bearish point, and the numbers give that view some weight:
- Trailing net income of about US$2.2 million on US$424.5 million of revenue leaves little room to absorb interest and other fixed charges if conditions become less favorable.
- The combination of weak interest coverage and a high earnings multiple of 94.5x means a lot is riding on the forecast earnings growth of roughly 50.7% a year actually showing up in future reported results.
Next Steps
Don't just look at this quarter; the real story is in the long-term trend. We've done an in-depth analysis on Energy Services of America's growth and its valuation to see if today's price is a bargain. Add the company to your watchlist or portfolio now so you don't miss the next big move.
See What Else Is Out There
ESOA’s thin 0.5% trailing net margin, weak interest coverage and high 94.5x P/E together point to a tight cushion against financial pressure.
If that mix of slim margins and fragile interest coverage makes you want a steadier profile, take a look at solid balance sheet and fundamentals stocks screener (45 results) to quickly focus on companies with stronger financial footing.
This article by Simply Wall St is general in nature. We provide commentary based on historical data and analyst forecasts only using an unbiased methodology and our articles are not intended to be financial advice. It does not constitute a recommendation to buy or sell any stock, and does not take account of your objectives, or your financial situation. We aim to bring you long-term focused analysis driven by fundamental data. Note that our analysis may not factor in the latest price-sensitive company announcements or qualitative material. Simply Wall St has no position in any stocks mentioned.