Enterprise Financial Services (EFSC) Stock Could Be 49% Below Fair Value After Recent Gains
Enterprise Financial Services Corp EFSC | 0.00 |
Enterprise Financial Services (EFSC) has drawn investor interest after recent share price moves, with the stock showing different short term and longer term return patterns that invite a closer look at its fundamentals and valuation.
The recent 30 day share price return of 4.46% and 90 day share price return of 17.30% suggest building momentum in Enterprise Financial Services, supported by a 1 year total shareholder return of 20.39% and a 3 year total shareholder return of 67.49%.
If you are comparing Enterprise Financial Services with other opportunities in the sector, this is a good moment to broaden your search and check out 20 top founder-led companies
With Enterprise Financial Services trading at $62.11, sitting about 7% below a consensus price target of $66.40 and carrying an estimated intrinsic value discount of around 49%, the key question is whether there is real value here or whether the market is already pricing in future growth.
Price to Earnings of 11.5x: Is it justified?
Enterprise Financial Services is trading on a P/E of 11.5x, which sits slightly below both its peer group and the wider US Banks industry based on the latest data.
The P/E ratio compares the company’s share price with its earnings per share, so it effectively shows how many dollars investors are paying for each dollar of current earnings.
For Enterprise Financial Services, this 11.5x P/E is modestly lower than the peer average of 12.8x and just under the US Banks industry average of 11.7x. This suggests the market is not assigning a premium despite the bank having high quality earnings and earnings growth of 9.1% per year over the past 5 years.
At the same time, the estimated fair P/E of 11x implies the current multiple is slightly above the level our fair ratio model points to as a potential anchor. This may be one reference point investors watch if sentiment or expectations change.
Result: Price-to-Earnings of 11.5x (ABOUT RIGHT)
However, the narrative around Enterprise Financial Services could shift if loan growth or credit quality trends fall short of expectations, or if funding costs pressure earnings.
Another view on Enterprise Financial Services’ value
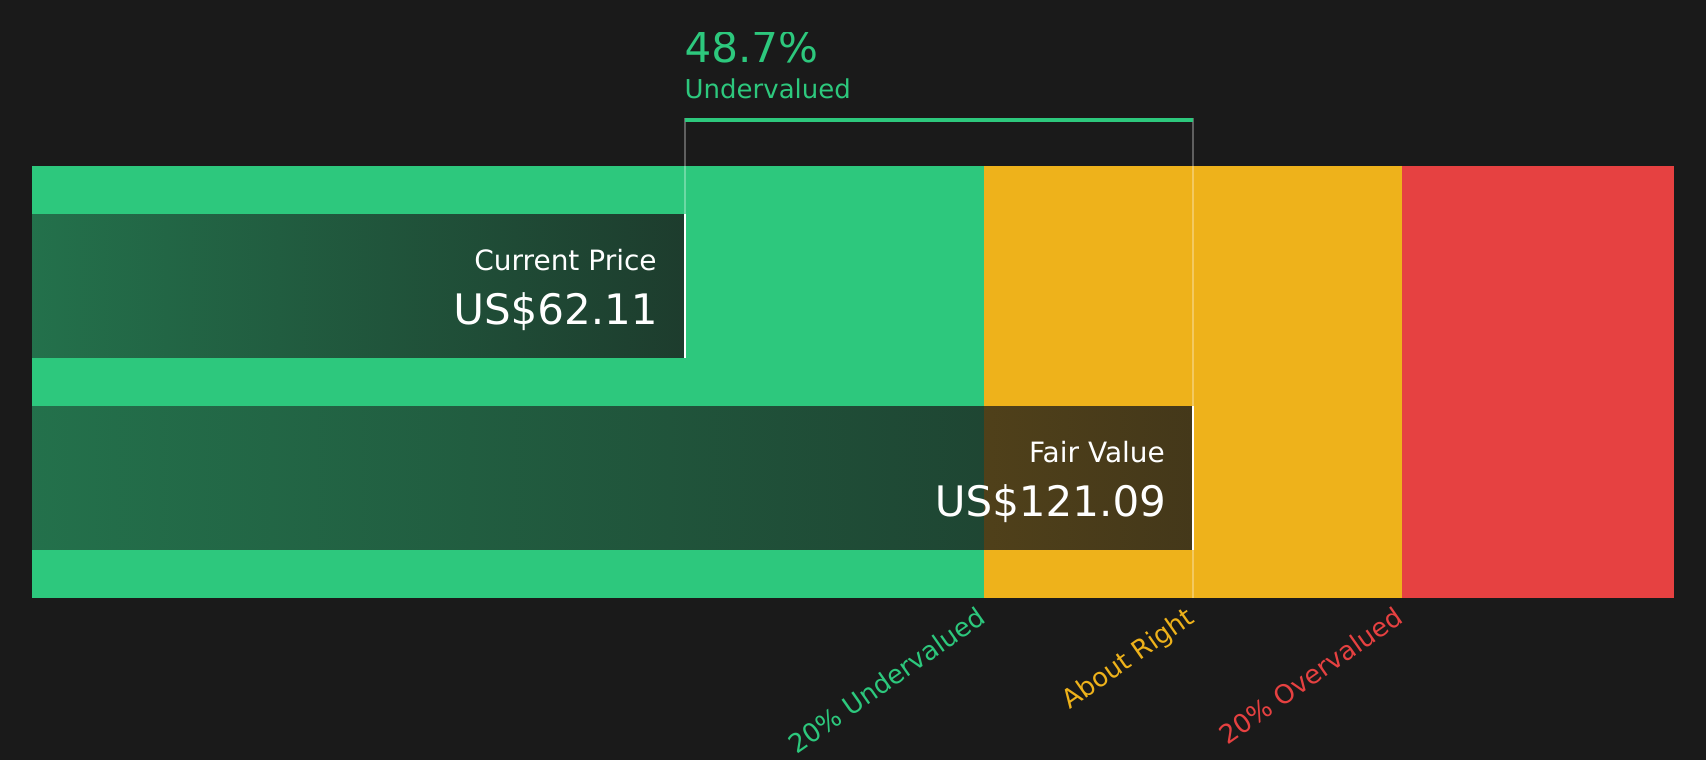
While the 11.5x P/E suggests Enterprise Financial Services is roughly aligned with its fair ratio of 11x, the SWS DCF model points in a different direction. With the stock at $62.11 and an estimated future cash flow value of $121.09, the DCF outcome frames EFSC as materially undervalued. For you, which lens feels more convincing?
Simply Wall St performs a discounted cash flow (DCF) on every stock in the world every day (check out Enterprise Financial Services for example). We show the entire calculation in full. You can track the result in your watchlist or portfolio and be alerted when this changes, or use our stock screener to discover 45 high quality undervalued stocks. If you save a screener we even alert you when new companies match - so you never miss a potential opportunity.
Next Steps
The mixed signals around Enterprise Financial Services can feel intriguing, so take a moment to review the numbers yourself and decide what they really suggest. To see what investors currently view as the key positives, check out the 4 key rewards.
Looking for more investment ideas beyond Enterprise Financial Services?
If Enterprise Financial Services has sharpened your focus on valuation and quality, do not stop here. Use the Simply Wall St screener to widen your opportunity set.
- Target stability and capital preservation by scanning for companies that pass strict risk checks using the 66 resilient stocks with low risk scores.
- Hunt for quality at a reasonable price by reviewing the 45 high quality undervalued stocks that pair solid fundamentals with attractive valuations.
- Build a watchlist of potential future standouts by checking the screener containing 20 high quality undiscovered gems that fewer investors may be tracking.
This article by Simply Wall St is general in nature. We provide commentary based on historical data and analyst forecasts only using an unbiased methodology and our articles are not intended to be financial advice. It does not constitute a recommendation to buy or sell any stock, and does not take account of your objectives, or your financial situation. We aim to bring you long-term focused analysis driven by fundamental data. Note that our analysis may not factor in the latest price-sensitive company announcements or qualitative material. Simply Wall St has no position in any stocks mentioned.