Equity Residential (EQR) Steady FFO Undercuts Bearish Narratives On Earnings Sustainability
Equity Residential EQR | 61.18 | -0.20% |
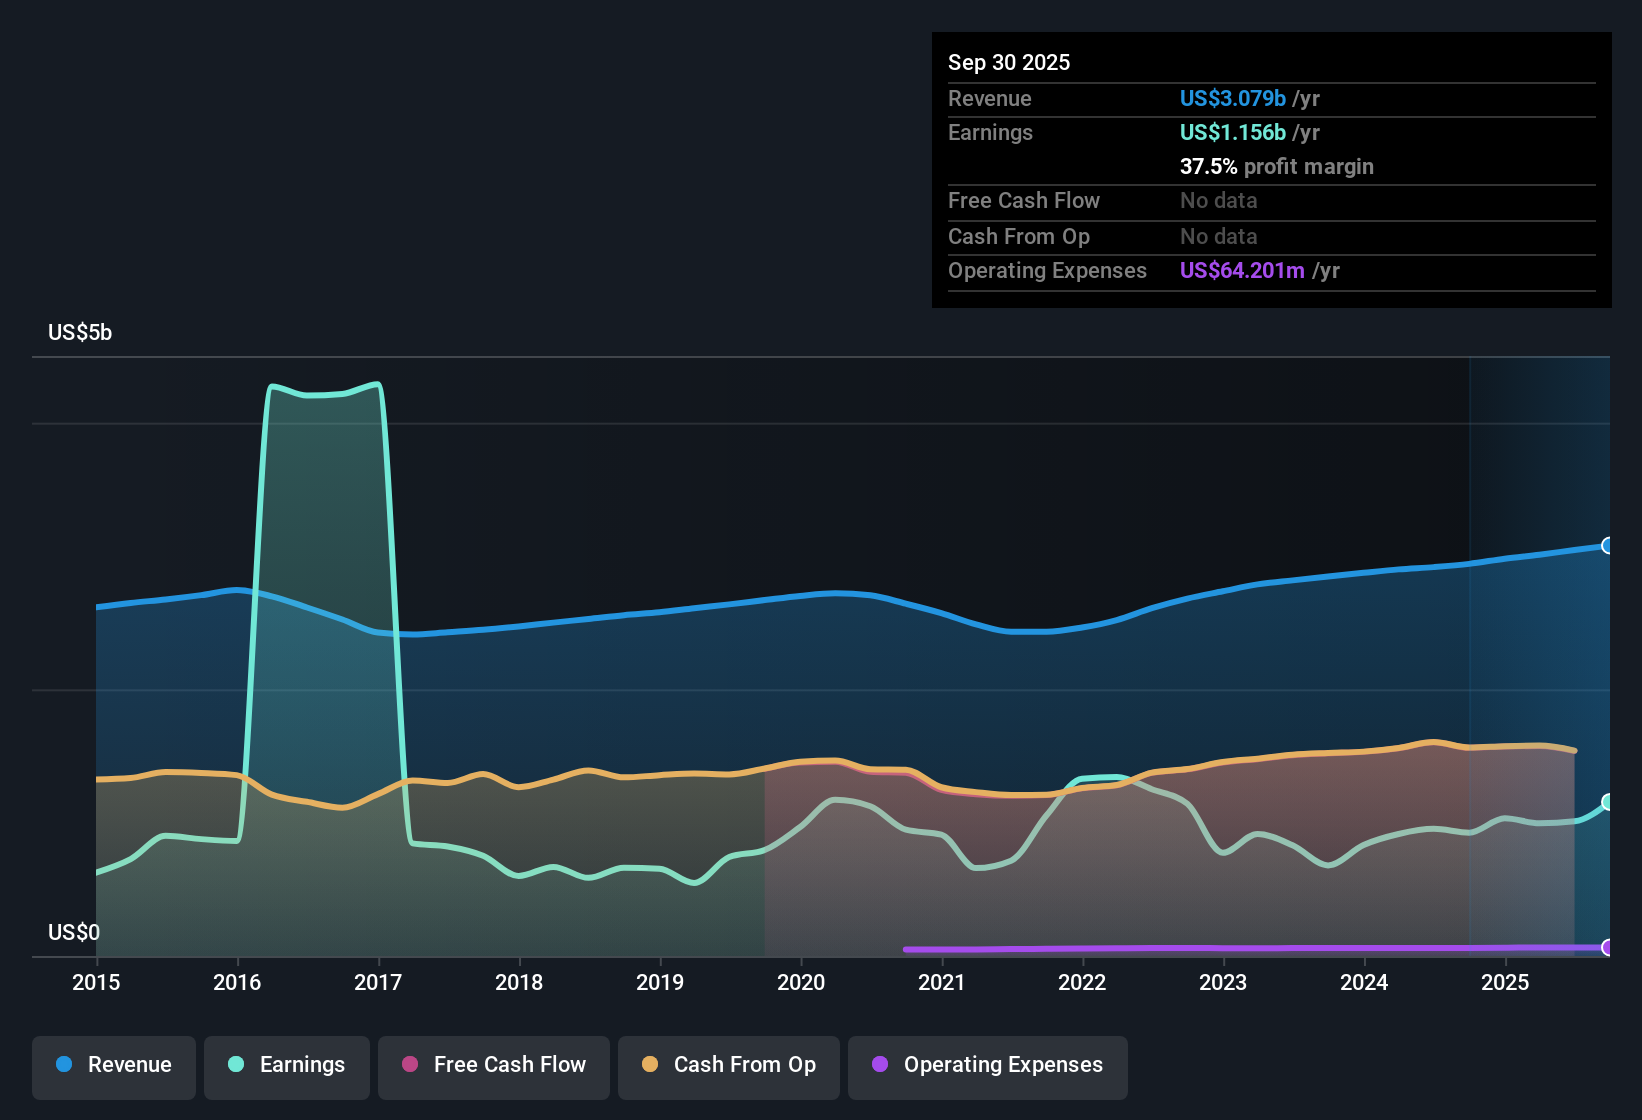
Equity Residential (EQR) has wrapped up FY 2025 with fourth quarter revenue of US$781.9 million and basic EPS of US$1.01, alongside funds from operations of US$376.8 million that remain a key gauge for this residential REIT. Over the past few quarters, the company has seen revenue move from US$766.8 million in Q4 2024 to US$781.9 million in Q4 2025. Trailing twelve month basic EPS was US$2.95 and net income reached about US$1.1 billion, which may lead investors to focus on how margins and recurring cash generation shape the story from here.
See our full analysis for Equity Residential.With the latest numbers on the table, the next step is to see how this earnings profile lines up against the widely held narratives about Equity Residential, and where the data may support or challenge those views.
36.2% net margin with a big one off boost
- Over the last 12 months, Equity Residential reported a 36.2% net margin compared with 34.7% a year earlier, but that period also included a US$603.2 million one off gain that had a material impact on earnings.
- What stands out for a more bullish angle is that trailing 12 month earnings grew 8.3% while the five year earnings growth rate was 1.4% per year. However, the presence of the US$603.2 million gain means anyone leaning optimistic has to separate that one time lift from the underlying profitability trend.
- Supporters who point to stronger recent profitability can reference the 36.2% margin and US$1.1b of trailing net income, but those figures are not directly comparable to earlier years because of the large non recurring gain.
- This tension between higher recent earnings and the one off item is central for investors who want to know how much of the past year’s performance reflects recurring rent and how much is tied to special items.
FFO of US$1.5b underpins the REIT story
- Across the last 12 months to Q4 2025, funds from operations came in at US$1.5b on US$3.1b of revenue, with quarterly FFO ranging from US$368.9 million to US$410.2 million. FFO per share figures such as US$0.95, US$0.97 and US$1.05 point to a fairly tight band over the year.
- What is interesting for a more cautious, bearish read is that despite this US$1.5b of FFO and relatively steady quarterly FFO per share, the data flags that debt is not well covered by operating cash flow. Earnings and revenue are both forecast to decline over the next three years at 14.7% per year and 4.1% annual growth respectively, so bears focus on how much of this FFO will need to support the balance sheet rather than grow distributions.
- Critics highlight that even with trailing FFO of US$1.5b and a 36.2% net margin, published forecasts still point to multi year earnings decline, which leans against the idea that the latest FFO run rate automatically carries through into future periods.
- Those same cautious investors also point to the flagged issue that debt coverage from operating cash flow is weak, which they see as a key reason to look beyond headline FFO and consider how much financial flexibility the REIT really has.
P/E of 21.6x versus DCF fair value of US$86.73
- The shares trade on a P/E of 21.6x, sitting below the North American Residential REITs average of 25.9x and a peer average of 42.2x. A DCF fair value of US$86.73 versus the current US$63.89 price implies the stock sits about 26.3% below that cash flow based estimate.
- Supporters looking for value arguments point out that this lower 21.6x P/E and the gap between the US$63.89 share price and the US$86.73 DCF fair value sit alongside 8.3% one year earnings growth and a 36.2% margin. Together, these data points heavily support the idea that the current price does not fully reflect the company’s recent profitability, even though the same data set shows a US$603.2 million one off gain and analyst forecasts of multi year earnings decline that temper how straightforward that value case is.
- On one hand, the discount to the DCF fair value and to the sector P/E averages appeals to investors who focus on cash flow based valuation and relative pricing within residential REITs.
- On the other hand, the flagged risks around declining forecast earnings and weaker debt coverage mean some investors treat that apparent discount as a fair reflection of the medium term challenges rather than as a simple mispricing.
Next Steps
Don't just look at this quarter; the real story is in the long-term trend. We've done an in-depth analysis on Equity Residential's growth and its valuation to see if today's price is a bargain. Add the company to your watchlist or portfolio now so you don't miss the next big move.
See What Else Is Out There
Equity Residential’s earnings story relies on a US$603.2 million one off gain and faces forecasts of multi year earnings decline alongside weak debt coverage.
If those cash flow and balance sheet gaps leave you cautious, check out our solid balance sheet and fundamentals stocks screener (45 results) to quickly find companies built on stronger financial footing.
This article by Simply Wall St is general in nature. We provide commentary based on historical data and analyst forecasts only using an unbiased methodology and our articles are not intended to be financial advice. It does not constitute a recommendation to buy or sell any stock, and does not take account of your objectives, or your financial situation. We aim to bring you long-term focused analysis driven by fundamental data. Note that our analysis may not factor in the latest price-sensitive company announcements or qualitative material. Simply Wall St has no position in any stocks mentioned.