

Erie Indemnity (ERIE) Could Be 18% Undervalued Before Q2 Earnings
Erie Indemnity Company Class A ERIE | 0.00 |
Erie Indemnity (ERIE) is drawing attention ahead of its upcoming Q2 earnings as investors weigh the impact of new products such as Erie Secure Auto and Business Auto 2.0, along with a refreshed online quote platform.
Erie Indemnity’s recent share price has come under pressure, with the stock down 4.1% over the last day and 22.3% year to date. The 1 year total shareholder return has declined 39.5%, suggesting momentum has weakened even as investors focus on upcoming Q2 earnings and product rollouts.
If you are weighing Erie Indemnity against other ideas in the market, it can help to see what else is setting up interestingly right now through 18 top founder-led companies
After Erie Indemnity’s sharp pullback and with Q2 expectations tied to new products and its online platform, the key question is whether the recent weakness has already priced in the risks, or whether most of the upside is already behind the stock.
Price-to-Earnings of 19.8x: Is it justified?
On traditional metrics, Erie Indemnity looks expensive, with a P/E of 19.8x compared to 12.5x for the broader US Insurance industry and 13.7x across peers.
The P/E multiple links what you are paying today to the company’s current earnings, which matters for a profitable insurer like Erie Indemnity that generated $571.4m in net income on $4.1b of revenue. A higher P/E often reflects expectations around earnings resilience, capital efficiency or business quality, rather than just near term growth.
Here, the tension is clear. Erie Indemnity’s P/E of 19.8x sits well above both the industry and peer averages, yet recent earnings have declined 7% year on year and net profit margins have moved from 15.7% to 14%. At the same time, the company has grown earnings by 18.7% per year over the past five years and currently posts a high return on equity of 24.3%. This may help explain why the market has been willing to pay a premium multiple despite weaker recent momentum.
The premium stands out versus the sector. Compared with the US Insurance industry P/E of 12.5x and peer average of 13.7x, Erie Indemnity’s 19.8x multiple suggests investors are assigning a materially higher value to its earnings stream than to typical insurance stocks, even though the latest one year return has lagged both the US market and the insurance group.
Result: Price-to-Earnings of 19.8x (OVERVALUED).
However, Erie Indemnity’s premium P/E could be challenged if Q2 earnings disappoint or if take up of Erie Secure Auto and Business Auto 2.0 falls short.
Another View on Erie Indemnity’s Value
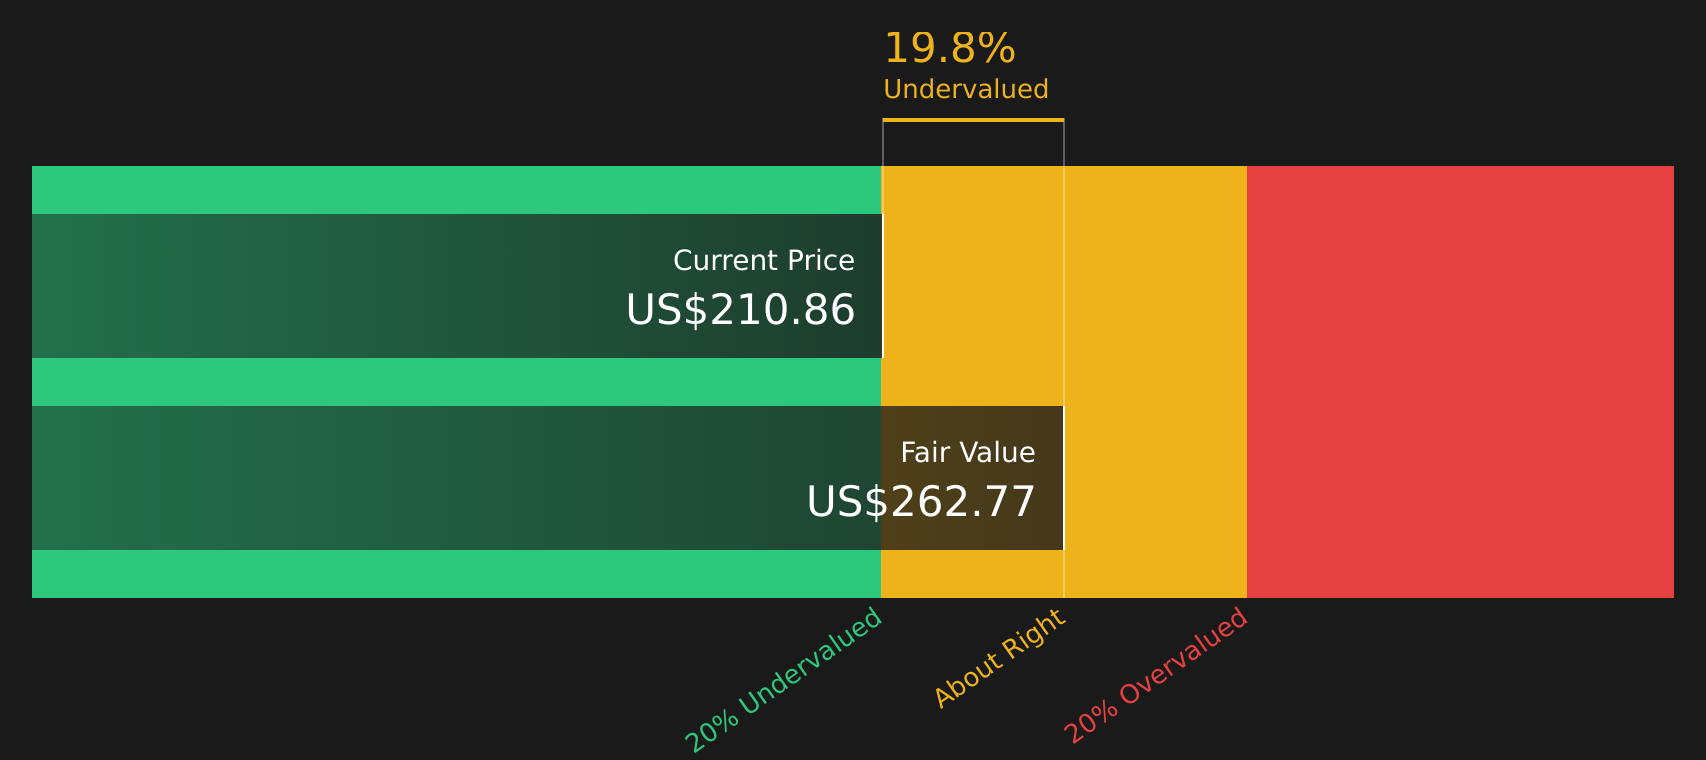
While the P/E of 19.8x makes Erie Indemnity look expensive next to the US Insurance industry at 12.5x and peers at 13.7x, our DCF model suggests a different angle, with an estimated future cash flow value of $262.77 versus the current $215.82 share price.
This implies the stock is trading about 17.9% below that estimate. This raises a simple question for investors: which signal deserves more weight, the premium earnings multiple or the discounted cash flow view?
Simply Wall St performs a discounted cash flow (DCF) on every stock in the world every day (check out Erie Indemnity for example). We show the entire calculation in full. You can track the result in your watchlist or portfolio and be alerted when this changes, or use our stock screener to discover 50 high quality undervalued stocks. If you save a screener we even alert you when new companies match - so you never miss a potential opportunity.
Next Steps
If the mixed signals around Erie Indemnity leave you unsure, it makes sense to move quickly and review the underlying data for yourself. To understand what investors see as the key positives right now, take a closer look at the 2 key rewards.
Looking for more investment ideas beyond Erie Indemnity?
If Erie Indemnity has sharpened your focus on valuation and quality, it is worth broadening your watchlist with other ideas that could fit your goals.
- Target resilience by checking out 81 resilient stocks with low risk scores that have historically shown lower volatility and may help steady your overall portfolio.
- Hunt for quality at a discount with the 50 high quality undervalued stocks that combine solid fundamentals with prices that appear out of step with their underlying numbers.
- Spot potential early movers through the 21 elite penny stocks with strong financials where smaller companies with stronger balance sheets and fundamentals might be flying under the radar.
This article by Simply Wall St is general in nature. We provide commentary based on historical data and analyst forecasts only using an unbiased methodology and our articles are not intended to be financial advice. It does not constitute a recommendation to buy or sell any stock, and does not take account of your objectives, or your financial situation. We aim to bring you long-term focused analysis driven by fundamental data. Note that our analysis may not factor in the latest price-sensitive company announcements or qualitative material. Simply Wall St has no position in any stocks mentioned.