Erie Indemnity (ERIE) Stock Could Be 14.1% Below Fair Value Despite Premium P E
Erie Indemnity Company Class A ERIE | 0.00 |
Erie Indemnity (ERIE) has drawn investor attention after recent share price swings, with the stock up slightly over the past month but down over the past 3 months and year to date.
At a share price of $225.64, Erie Indemnity’s recent moves reflect fading momentum, with the share price down over the past quarter and year to date, while the 3 and 5 year total shareholder returns remain positive.
If recent moves in Erie Indemnity have you reassessing your portfolio, this could be a good moment to widen the search and review 20 top founder-led companies
So, with Erie Indemnity stock posting a decline of 18.8% year to date and trading at an estimated 14.1% discount to its assessed intrinsic value, is there mispricing here, or is the market already pricing in expectations for future growth?
Price-to-Earnings of 20.6x: Is it justified?
On traditional metrics, Erie Indemnity looks expensive, with a P/E of 20.6x compared with both the US insurance industry average of 11.2x and a peer average of 13.2x.
The P/E ratio compares the current share price with earnings per share, so a higher P/E often reflects the market assigning a richer price to each dollar of profit. For Erie Indemnity, that higher multiple can imply investors are willing to pay up relative to other insurance stocks for its earnings profile, despite recent share price weakness and a 1 year total return that has lagged both the wider US market and the US insurance industry.
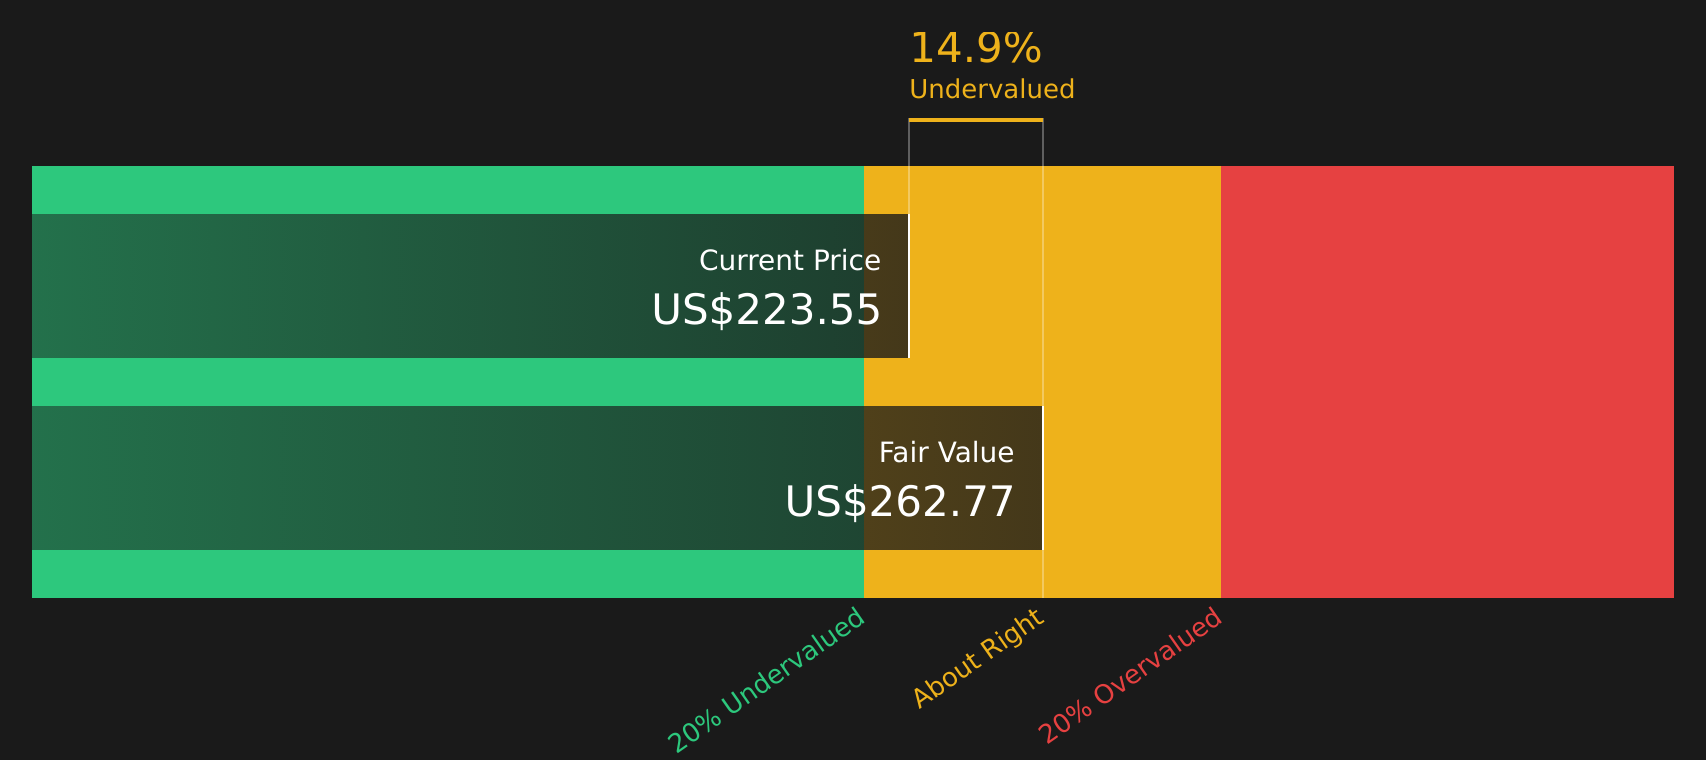
Against this context, the SWS DCF model currently points to a fair value of $262.77 per share, which is about 14.1% above the last close of $225.64. That disconnect, alongside high quality earnings, a 24.3% Return on Equity and 5 year earnings growth of 18.7% per year, indicates that the market is applying a premium multiple while the DCF model indicates the current price sits at a discount to its assessed cash flow value.
Compared with sector peers, the gap is clear. Erie Indemnity trades on a P/E that is almost twice the broader US insurance industry average and meaningfully ahead of its peer group, which means investors are paying a noticeably higher price for each dollar of earnings than the typical stock in the space.
Result: Price-to-Earnings of 20.6x (OVERVALUED).
However, investors in Erie Indemnity also face the risk that any reassessment of growth expectations or sector sentiment could compress that premium P/E multiple and put pressure on the stock.
Another View: SWS DCF versus Erie Indemnity’s Market Price
While the 20.6x P/E suggests Erie Indemnity stock is expensive relative to insurance peers, the SWS DCF model points the other way, indicating the shares are trading about 14.1% below an estimated fair value of $262.77. So which signal matters more for you right now?
Simply Wall St performs a discounted cash flow (DCF) on every stock in the world every day (check out Erie Indemnity for example). We show the entire calculation in full. You can track the result in your watchlist or portfolio and be alerted when this changes, or use our stock screener to discover 44 high quality undervalued stocks. If you save a screener we even alert you when new companies match - so you never miss a potential opportunity.
Next Steps
If this mixed picture around Erie Indemnity leaves you unsure, take it as a prompt to act quickly: review the underlying data and stress test your own thesis against the 2 key rewards
Looking for more investment ideas beyond Erie Indemnity?
If conditions around Erie Indemnity have sharpened your focus, do not sit still. Use this moment to broaden your watchlist and compare alternatives with stronger fits.
- Target potential value opportunities by reviewing the 44 high quality undervalued stocks that combine quality fundamentals with attractive pricing signals.
- Strengthen your income focus by scanning the 9 dividend fortresses that offer higher yields alongside resilient business profiles.
- Upgrade your defense by assessing the 67 resilient stocks with low risk scores that show more measured risk scores and steadier financial profiles.
This article by Simply Wall St is general in nature. We provide commentary based on historical data and analyst forecasts only using an unbiased methodology and our articles are not intended to be financial advice. It does not constitute a recommendation to buy or sell any stock, and does not take account of your objectives, or your financial situation. We aim to bring you long-term focused analysis driven by fundamental data. Note that our analysis may not factor in the latest price-sensitive company announcements or qualitative material. Simply Wall St has no position in any stocks mentioned.