Erie Indemnity (ERIE) Valuation Check After Mixed Recent Returns And Premium P/E Multiple
Erie Indemnity Company Class A ERIE | 249.51 | +1.02% |
Why Erie Indemnity (ERIE) is on investors’ radar now
Erie Indemnity (ERIE) has drawn fresh attention after recent price moves, with a 1 day return of about 1.3% and a modest gain over the past month, contrasting with weaker performance over the past 3 months.
For investors tracking consistency, that mixed return profile sits alongside reported annual revenue of about US$4.0b and net income of roughly US$648m. Revenue and earnings growth figures are also available for closer review.
Zooming out, Erie Indemnity’s recent 1 day and 7 day share price gains sit against a weaker 90 day share price return of an 11.1% decline and a 1 year total shareholder return of a 23.4% decline. This suggests momentum has eased following earlier periods of positive total shareholder returns.
If this shift in sentiment has you reassessing your watchlist, it could be a good moment to broaden your search with fast growing stocks with high insider ownership.
With ERIE trading around US$286.88 after a 23.4% 1 year total return decline, but ongoing reported revenue of about US$4.0b and net income near US$648m, is this a potential entry point or is future growth already priced in?
Price-to-Earnings of 23.2x: Is it justified?
With Erie Indemnity last closing at US$286.88, the stock is trading on a P/E of 23.2x, which screens as expensive relative to both peers and the wider US Insurance industry.
The P/E ratio compares the current share price to earnings per share, so a higher multiple usually means the market is paying more today for each dollar of current earnings. For a mature insurance related business, investors often look at P/E to gauge how much future profit growth and return on equity strength are being reflected in the price.
In ERIE’s case, earnings are forecast to grow around 10.2% per year and the company currently reports high quality earnings, a 28.1% return on equity and net profit margins of 16%. Set against that, the current 23.2x P/E sits well above the estimated fair P/E of 15.1x. This suggests the market price is richer than the level that regression based fair value work points to and may need to move closer to that fair ratio if expectations cool.
Compared with the US Insurance industry average P/E of 12.6x and a peer group average of 13.3x, ERIE’s 23.2x multiple is materially higher. This means investors are paying a sizeable premium versus sector norms for its earnings profile.
Result: Price-to-Earnings of 23.2x (OVERVALUED)
However, that premium P/E could be tested if revenue or net income growth around 5.6% and 10.2% slows, or if sector valuations compress further.
Another view on value
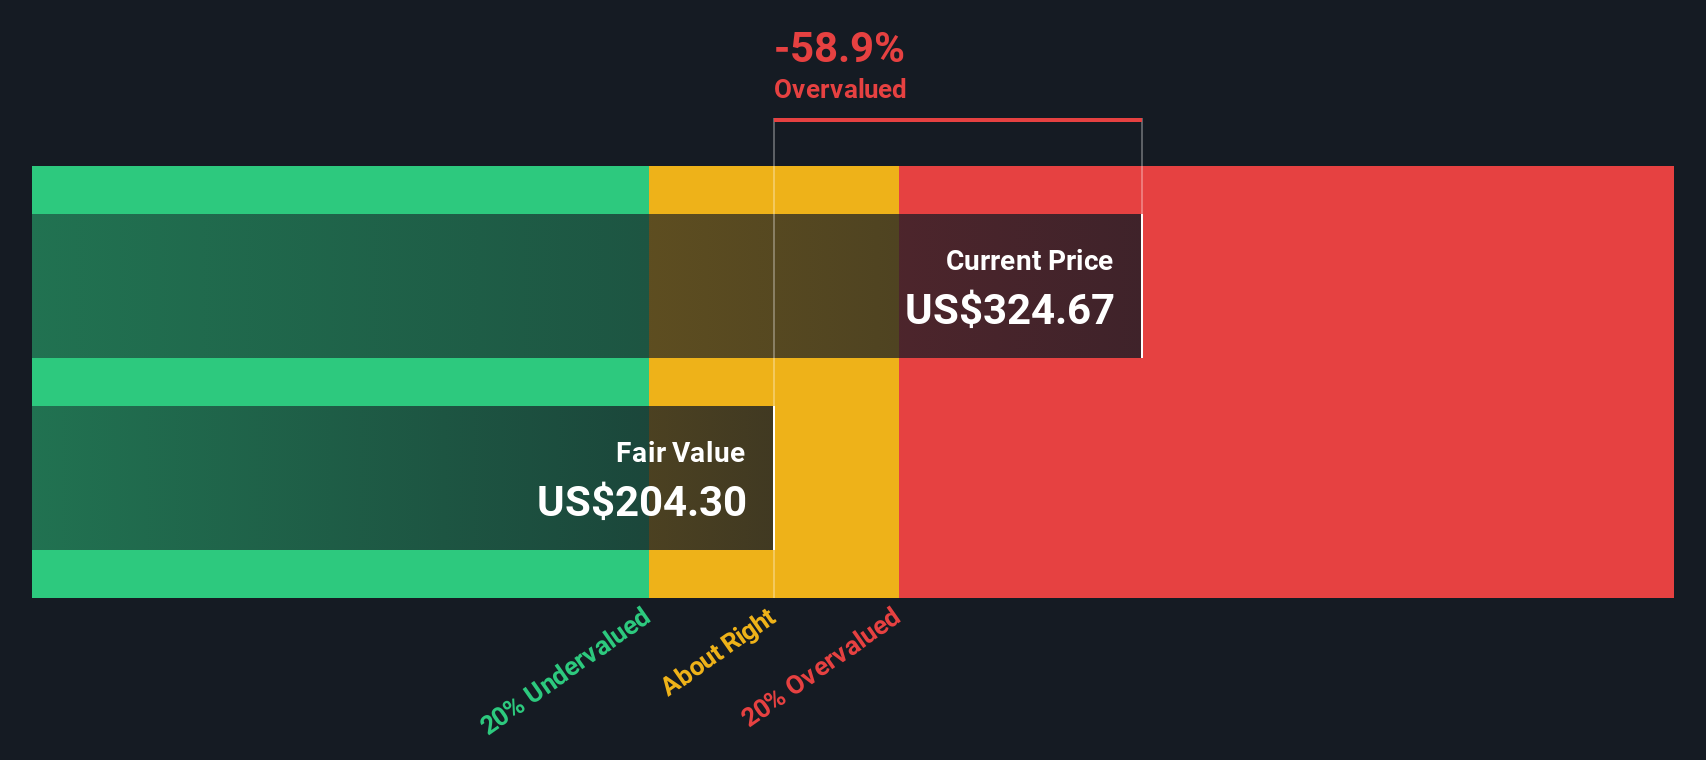
Our DCF model tells a different story to the P/E ratio. On that approach, ERIE at US$286.88 sits above an estimated fair value of US$221.51. This points to shares being overvalued rather than just fully priced. The question is which signal you trust more: earnings multiples or cash flow math?
Simply Wall St performs a discounted cash flow (DCF) on every stock in the world every day (check out Erie Indemnity for example). We show the entire calculation in full. You can track the result in your watchlist or portfolio and be alerted when this changes, or use our stock screener to discover 877 undervalued stocks based on their cash flows. If you save a screener we even alert you when new companies match - so you never miss a potential opportunity.
Build Your Own Erie Indemnity Narrative
If you see the numbers differently or prefer to work through the data yourself, you can build a custom view of ERIE in just a few minutes, starting with Do it your way.
A good starting point is our analysis highlighting 3 key rewards investors are optimistic about regarding Erie Indemnity.
Looking for more investment ideas?
If ERIE has your attention, do not stop there. Use the screeners below to quickly surface fresh ideas that might fit what you are really looking for.
- Spot potential value opportunities by checking out these 877 undervalued stocks based on cash flows that align more closely with the kind of pricing you want to pay for future cash flows.
- Tap into long term themes in technology and automation by reviewing these 23 AI penny stocks that might fit your view on where digital profits could come from.
- Strengthen your income watchlist by scanning these 13 dividend stocks with yields > 3% and see which names line up with your yield and payout preferences.
This article by Simply Wall St is general in nature. We provide commentary based on historical data and analyst forecasts only using an unbiased methodology and our articles are not intended to be financial advice. It does not constitute a recommendation to buy or sell any stock, and does not take account of your objectives, or your financial situation. We aim to bring you long-term focused analysis driven by fundamental data. Note that our analysis may not factor in the latest price-sensitive company announcements or qualitative material. Simply Wall St has no position in any stocks mentioned.