Exploring 3 Top Undervalued Small Caps With Insider Action Across Regions
CEVA, Inc. CEVA | 0.00 |
Over the last 7 days, the United States market has experienced a rise of 3.2%, contributing to a 31% increase over the past year, with earnings forecasted to grow by 16% annually. In this dynamic environment, identifying small-cap stocks that are potentially undervalued and exhibit insider activity can offer intriguing opportunities for investors seeking value in diverse regions.
Top 10 Undervalued Small Caps With Insider Buying In The United States
| Name | PE | PS | Discount to Fair Value | Value Rating |
|---|---|---|---|---|
| First United | 9.7x | 2.8x | 46.65% | ★★★★★☆ |
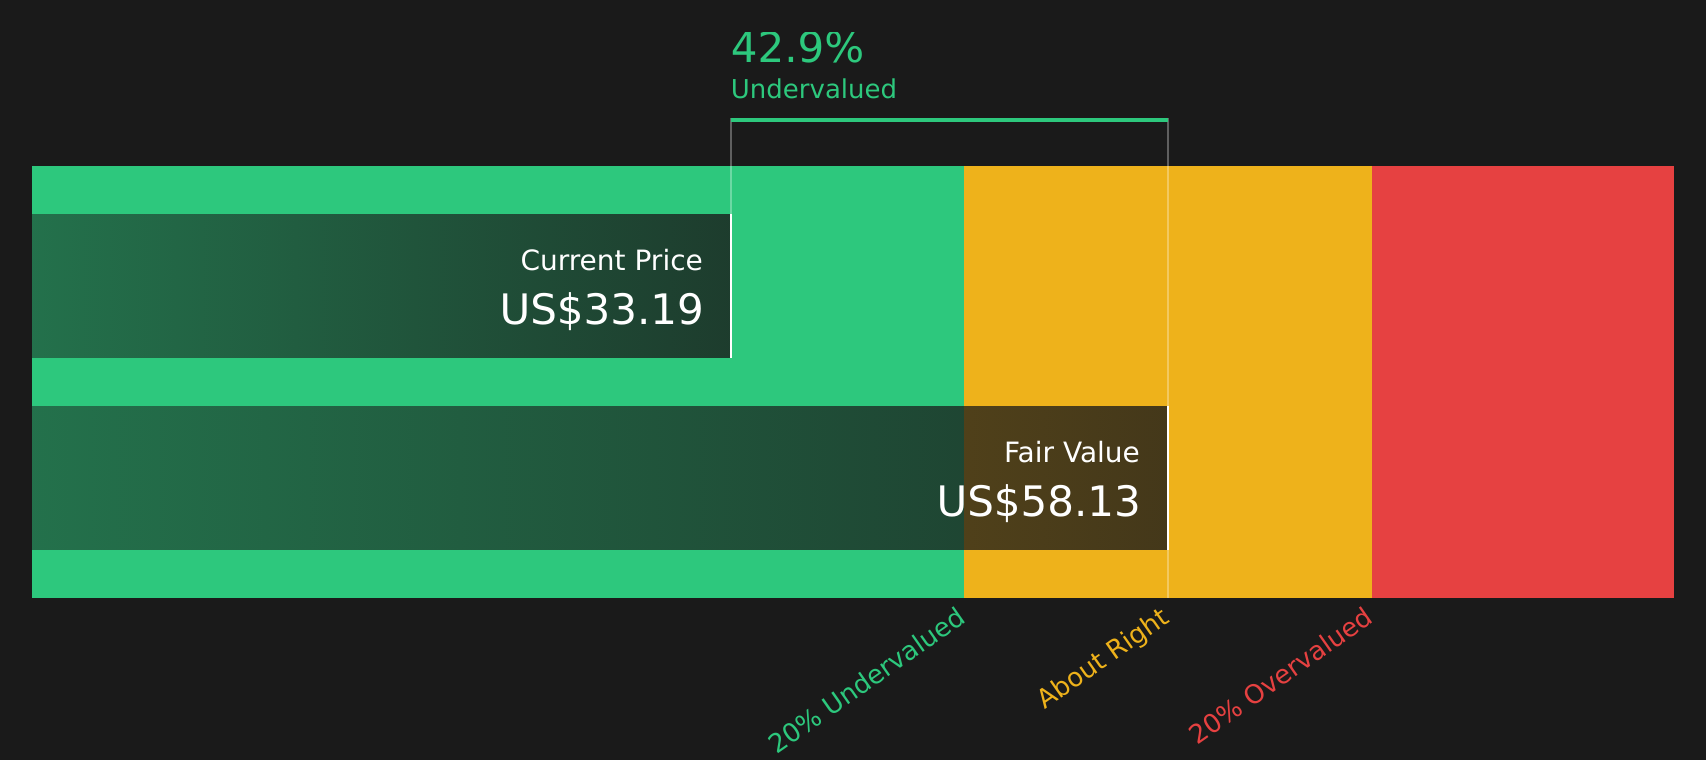
| Financial Institutions | 9.0x | 2.9x | 31.34% | ★★★★★☆ |
| Metropolitan Bank Holding | 13.0x | 3.7x | 39.83% | ★★★★☆☆ |
| First Bancorp | 9.0x | 3.4x | 43.49% | ★★★★☆☆ |
| PCB Bancorp | 8.9x | 3.1x | 16.33% | ★★★★☆☆ |
| Aldeyra Therapeutics | NA | NA | 45.82% | ★★★★☆☆ |
| Bank of Marin Bancorp | NA | 11.7x | 33.78% | ★★★☆☆☆ |
| Bank of the James Financial Group | 9.6x | 2.1x | 39.84% | ★★★☆☆☆ |
| New Peoples Bankshares | 9.9x | 2.4x | 21.02% | ★★★☆☆☆ |
| CEVA | NA | 8.6x | -109.11% | ★★★☆☆☆ |
Below we spotlight a couple of our favorites from our exclusive screener.
CEVA (CEVA)
Simply Wall St Value Rating: ★★★☆☆☆
Overview: CEVA is a technology company specializing in the licensing of intellectual property, with operations focused on providing semiconductor solutions and a market cap of approximately $0.84 billion.
Operations: CEVA generates revenue primarily through the licensing of intellectual property, with a recent revenue figure of $109.60 million. The company's cost structure includes significant research and development expenses, which reached $74.83 million in the latest period. Gross profit margin has shown variability, with a recent value of 87.08%.
PE: -88.3x
CEVA stands out in the small-cap category, with its innovative RealSpace audio technology recently selected by Lenovo for a new headset, highlighting industry recognition. Despite reporting a net loss of US$10.64 million for 2025, revenue increased to US$109.6 million from the previous year. The company has not diluted shares over the past year and shows insider confidence through share purchases completed under a long-term buyback plan announced in 2014. CEVA's advancements in UWB and 5G-NTN technologies position it well for future growth opportunities across various sectors.

Financial Institutions (FISI)
Simply Wall St Value Rating: ★★★★★☆
Overview: Financial Institutions operates primarily in the banking sector with additional income from investment advisory services, and it has a market capitalization of approximately $0.31 billion.
Operations: The company's primary revenue stream is derived from its banking operations, contributing $233.33 million, while investment advisory income adds $11.86 million. Operating expenses are significant, with general and administrative expenses consistently forming a large portion of these costs. Over recent periods, the net income margin has shown variability but was recorded at 32.38% in the latest available data point for March 2026.
PE: 9.0x
Financial Institutions, Inc. has shown promising financial performance with net interest income rising to US$51.99 million in Q1 2026 from US$46.86 million a year prior, and net income reaching US$20.99 million compared to US$16.88 million previously. Insider confidence is evident as they have been actively purchasing shares, while the company completed a buyback of 500,066 shares for $15.91 million by March 31, 2026. The recent dividend increase reflects a stable cash flow position and commitment to shareholder returns amidst board changes as Donald K. Boswell steps down after nine years of service to pursue other interests.
agilon health (AGL)
Simply Wall St Value Rating: ★★★☆☆☆
Overview: Agilon Health is a healthcare company that partners with primary care physicians to provide value-based care for seniors, with a market cap of approximately $7.58 billion.
Operations: AGL generates revenue primarily through its healthcare services, with recent figures showing $5.82 billion in revenue for the quarter ending March 31, 2026. The company's cost structure is heavily influenced by COGS, which was $5.97 billion during the same period, resulting in a gross profit margin of -2.50%. Operating expenses are significant as well, with general and administrative expenses accounting for a substantial portion at $215.15 million in the latest quarter.
PE: -2.7x
Agilon health, a healthcare company with a focus on physician-led value-based care, has seen significant changes recently. They reported Q1 2026 revenue of US$1.42 billion, down from US$1.53 billion the previous year, yet net income rose to US$48.92 million from US$12.11 million. Insider confidence was evident in recent share purchases by executives in early 2026, suggesting belief in the company's strategy despite its current unprofitability and reliance on higher-risk funding sources like external borrowing. A reverse stock split effective March 31 aimed to enhance marketability and meet NYSE listing requirements while new CEO Tim O’Rourke's leadership is expected to leverage his extensive healthcare experience for future growth amid ongoing industry demand for innovative care solutions.

Next Steps
- Access the full spectrum of 68 Undervalued US Small Caps With Insider Buying by clicking on this link.
- Invested in any of these stocks? Simplify your portfolio management with Simply Wall St and stay ahead with our alerts for any critical updates on your stocks.
- Enhance your investing ability with the Simply Wall St app and enjoy free access to essential market intelligence spanning every continent.
Ready For A Different Approach?
- Explore high-performing small cap companies that haven't yet garnered significant analyst attention.
- Fuel your portfolio with companies showing strong growth potential, backed by optimistic outlooks both from analysts and management.
- Find companies with promising cash flow potential yet trading below their fair value.
This article by Simply Wall St is general in nature. We provide commentary based on historical data and analyst forecasts only using an unbiased methodology and our articles are not intended to be financial advice. It does not constitute a recommendation to buy or sell any stock, and does not take account of your objectives, or your financial situation. We aim to bring you long-term focused analysis driven by fundamental data. Note that our analysis may not factor in the latest price-sensitive company announcements or qualitative material. Simply Wall St has no position in any stocks mentioned.