F5 (FFIV) Stock Price Near Fair Value After Strong Multi‑Year Run
F5, Inc. FFIV | 0.00 |
- If you are wondering whether F5 is priced fairly or stretched at its current US$394.53 share price, you are not alone. This article focuses on what that number might really mean for valuation minded investors.
- F5's share price sits at US$394.53, with returns of 0.8% over the past week, 2.9% over the past month, 53.7% year to date and 34.0% over the last year. This puts recent moves in the context of stronger multi year performance of 170.0% over three years and 109.9% over five years.
- Recent coverage of F5 has centered on how the stock's strong multi year returns have shaped investor expectations and raised questions about what is already priced in. That context matters when assessing whether current levels reflect fundamentals or simply past momentum being carried forward.
- On Simply Wall St's valuation checks, F5 scores 2 out of 6. The next sections will walk through what different valuation methods say about the stock today, and then finish with a broader way to think about valuation that can help place all of those models in context.
F5 scores just 2/6 on our valuation checks. See what other red flags we found in the full valuation breakdown.
Approach 1: F5 Discounted Cash Flow (DCF) Analysis
A Discounted Cash Flow, or DCF, model estimates what F5 might be worth today by projecting its future free cash flows and discounting those back into present value using a required rate of return. It is essentially asking what a stream of future cash in your hand later is worth in your hand now.
For F5, the latest twelve month free cash flow is about $967.8m. Analysts provide explicit projections for several years, and Simply Wall St then extends those estimates out to 10 years using its own assumptions. By 2029, free cash flow is projected at $1,342.0m, with later years rising into the mid $1.8b range in nominal terms. All figures are expressed in dollars and then discounted back to today.
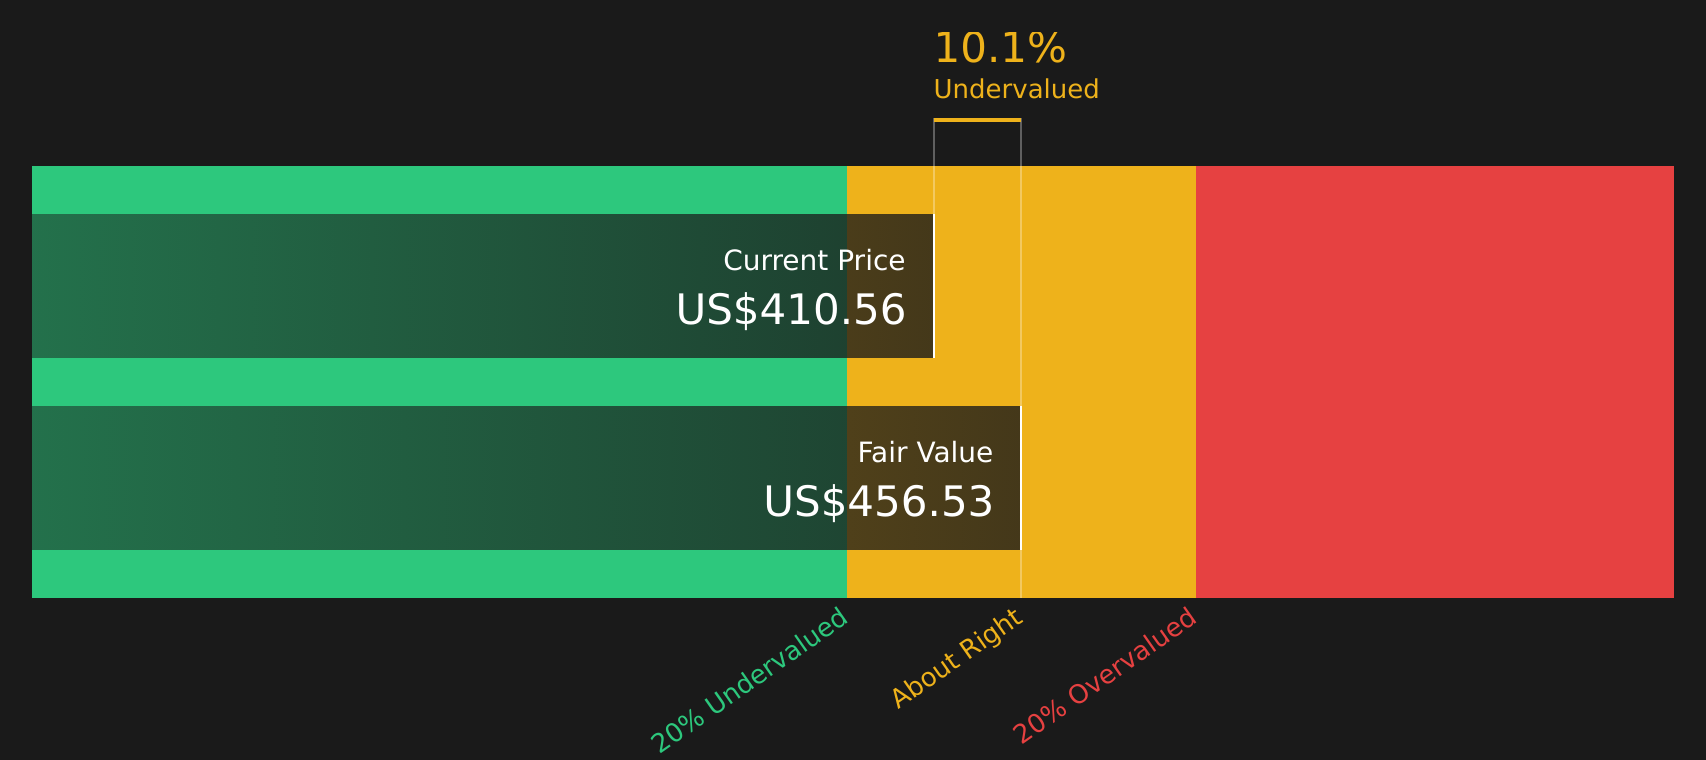
Adding these discounted cash flows together, plus a terminal value, produces an estimated intrinsic value of about $457.71 per share using a 2 Stage Free Cash Flow to Equity model. Compared with the current F5 share price of $394.53, this estimate is about 13.8% higher, which indicates a margin of undervaluation according to this framework.
Result: UNDERVALUED
Our Discounted Cash Flow (DCF) analysis suggests F5 is undervalued by 13.8%. Track this in your watchlist or portfolio, or discover 44 more high quality undervalued stocks.
Approach 2: F5 Price vs Earnings
For profitable companies like F5, the P/E ratio is a widely used check because it compares what you pay per share with the earnings that each share generates. The higher the growth expectations or the lower the perceived risk, the more investors are usually willing to pay, which can justify a higher P/E. The opposite is true when growth expectations are modest or risks are elevated.
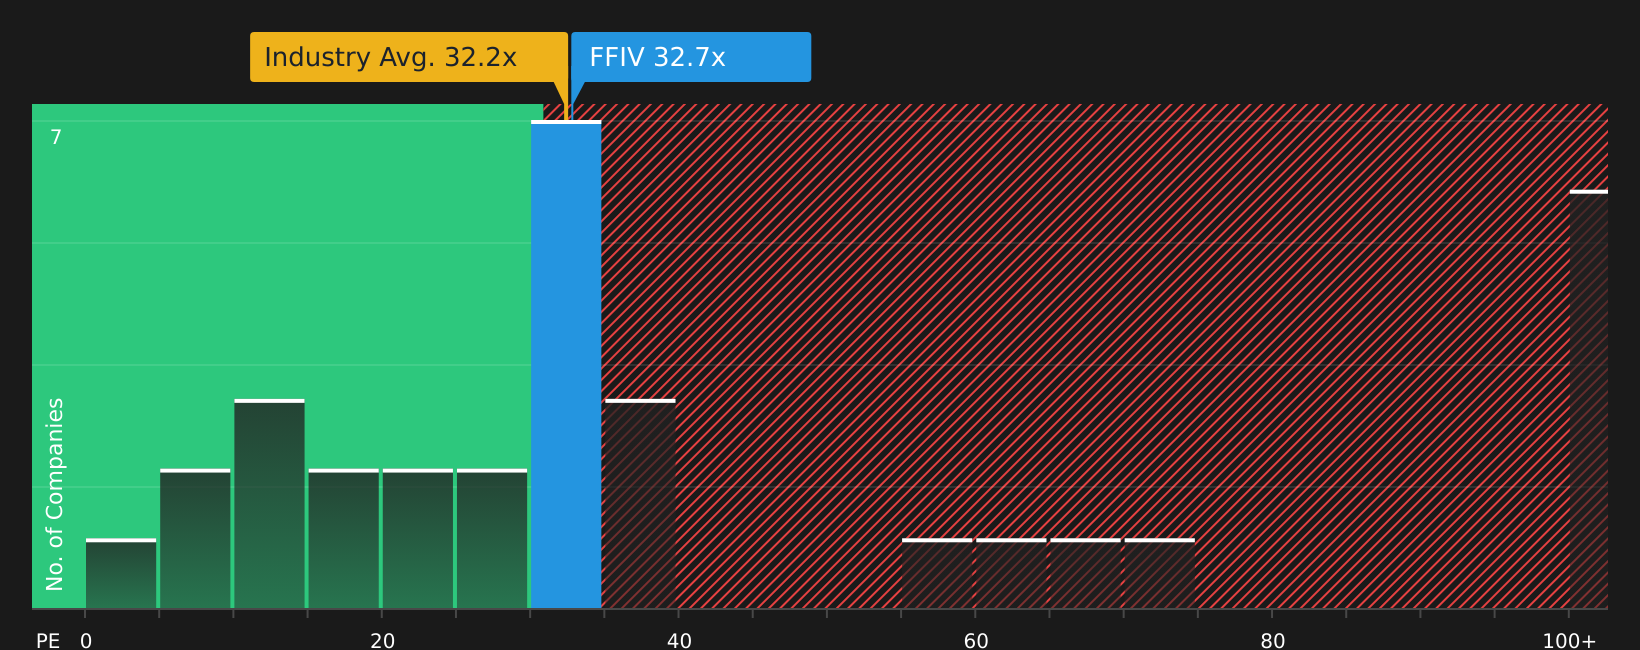
F5 currently trades on a P/E of 31.43x. This sits very close to the Communications industry average of 31.28x and is well below the peer average of 91.36x. Simply Wall St also calculates a proprietary “Fair Ratio” for F5 of 29.15x. This is the P/E level that would be expected given factors such as the company’s earnings growth profile, industry, profit margins, market cap and risk characteristics.
The Fair Ratio is designed to be more tailored than a simple comparison with peers or an industry average because it incorporates company specific metrics rather than relying on broad groupings. Comparing the current 31.43x P/E with the 29.15x Fair Ratio suggests F5 is trading at a small premium to what this framework considers fair value.
Result: OVERVALUED
P/E ratios tell one story, but what if the real opportunity lies elsewhere? Start investing in legacies, not executives. Discover our 20 top founder-led companies.
Upgrade Your Decision Making: Choose your F5 Narrative
Earlier the article mentioned that there is an even better way to understand valuation. Narratives on Simply Wall St give you a clear story for F5 that links your view of its business, your assumptions for future revenue, earnings and margins, and a resulting Fair Value that you can compare with the current price. Each Narrative lives in the Community page, updates automatically when new news or earnings arrive, and allows different investors to hold very different but clearly quantified views, such as a more optimistic scenario with a Fair Value of US$464.25 or a more cautious one closer to US$301.32. Everything is framed so you can quickly see whether your chosen Narrative suggests F5 looks expensive or cheap on those assumptions.
For F5, however, we will make it really easy for you with previews of two leading F5 Narratives:
Each one takes the same raw information about F5 and turns it into a different, clearly quantified story. Looking at both side by side can help you decide which assumptions feel closer to your own view of the stock at US$394.53.
Fair value in this Narrative: US$409.00
Current price vs this fair value: about 3.5% below the Narrative fair value
Revenue growth used in this Narrative: 6.77%
- Analysts in this camp expect F5 to grow revenue at a mid single digit rate while nudging profit margins higher, with earnings modeled at US$904.2m and EPS of US$16.73 by around June 2029.
- The story relies on ongoing demand for hybrid multicloud application delivery and security, plus early traction in AI related offerings and partnerships, as support for continued cash generation and a higher mix of recurring software and SaaS revenue.
- On these assumptions, the Narrative uses a P/E of 31.0x on 2029 earnings and an 8.6% discount rate to arrive at a fair value only modestly above the current price. This implies analysts as a group see F5 as close to fairly priced on this set of expectations.
Fair value in this Narrative: US$301.32
Current price vs this fair value: about 31.0% above the Narrative fair value
Revenue growth used in this Narrative: 3.94%
- This more cautious Narrative assumes slower revenue growth of about 3.9% a year and only a small improvement in profit margins to 22.6%, with earnings modeled at US$819.3m and EPS of US$15.10 by around June 2029.
- The focus is on risks around hardware refresh cycles, component costs, competition in application and API security, and the possibility that AI workloads and hybrid multicloud projects do not scale as quickly as the more optimistic scenarios imply.
- Here, a lower future P/E of 25.2x is applied to those 2029 earnings with a similar discount rate. This pulls the fair value down well below the current share price and frames F5 as priced for stronger outcomes than this Narrative is willing to assume.
Taken together, these Narratives show how different views on F5's revenue growth, margins and future P/E can move fair value estimates from around US$301 to about US$409. The key step for you is to decide which set of assumptions feels more realistic, or to build your own version that sits somewhere in between.
Do you think there's more to the story for F5? Head over to our Community to see what others are saying!

This article by Simply Wall St is general in nature. We provide commentary based on historical data and analyst forecasts only using an unbiased methodology and our articles are not intended to be financial advice. It does not constitute a recommendation to buy or sell any stock, and does not take account of your objectives, or your financial situation. We aim to bring you long-term focused analysis driven by fundamental data. Note that our analysis may not factor in the latest price-sensitive company announcements or qualitative material. Simply Wall St has no position in any stocks mentioned.