

Farmers & Merchants Bank Of Long Beach (FMBL) Looks Pricey Following Arkansas Expansion Move
FARMERS & MERCHANTS BANK (CALIF) FMBL | 0.00 |
Farmers & Merchants Bank of Long Beach (FMBL) has drawn fresh attention after appointing Brent Morgan as Regional President for Central Arkansas, aligning leadership with its expansion into the Little Rock banking market.
The appointment of Brent Morgan comes as Farmers & Merchants Bank of Long Beach trades at US$9,200.00 per share, with a 30 day share price return of 6.98% and an 11.11% year to date share price return, alongside a 1 year total shareholder return of 65.46%. This points to strong recent momentum building on longer term gains over three and five years.
If leadership changes and regional expansion at Farmers & Merchants Bank of Long Beach have you thinking about where growth-focused management teams could matter most next, it may be worth broadening your search with the 20 top founder-led companies
After the latest move in Farmers & Merchants Bank of Long Beach, the gap between its US$9,200 share price and various fair value estimates stands out. So where does a reasonable valuation actually sit along that range?
Price-to-Earnings of 15.1x: Is it justified?
On simple earnings terms, Farmers & Merchants Bank of Long Beach trades on a P/E of 15.1x. The last close sits at $9,200, and recent returns have been strong.
The P/E ratio compares the current share price with earnings per share, giving a quick sense of how much investors are paying for each dollar of profits. For a bank like Farmers & Merchants Bank of Long Beach, this often reflects what the market is willing to pay for its earnings profile, including recent profit trends and perceived business quality.
Here, Farmers & Merchants Bank of Long Beach is described as expensive versus its peer group P/E of 14.6x. Investors are paying a small premium compared with similar stocks. That premium sits alongside a rebound in earnings, with profit growth of 50.8% over the past year after several years of declining earnings, and high quality earnings flagged in the data.
The comparison with the broader US Banks industry is even starker. The 15.1x P/E is above the sector average of 12.2x, which signals a clearly richer earnings multiple than typical banks.
Result: Price-to-Earnings of 15.1x (OVERVALUED)
However, investors should still watch for any setbacks in Farmers & Merchants Bank of Long Beach's regional expansion or shifts in earnings quality that could challenge this richer valuation.
Another View: Farmers & Merchants Bank of Long Beach Through a Cash Flow Lens
The P/E ratio paints Farmers & Merchants Bank of Long Beach as slightly expensive, but the SWS DCF model points to a different story. On that cash flow based view, the current $9,200 share price sits above an estimated future cash flow value of $2,383.19, which leans toward an overvalued reading. Which signal should carry more weight for you right now?
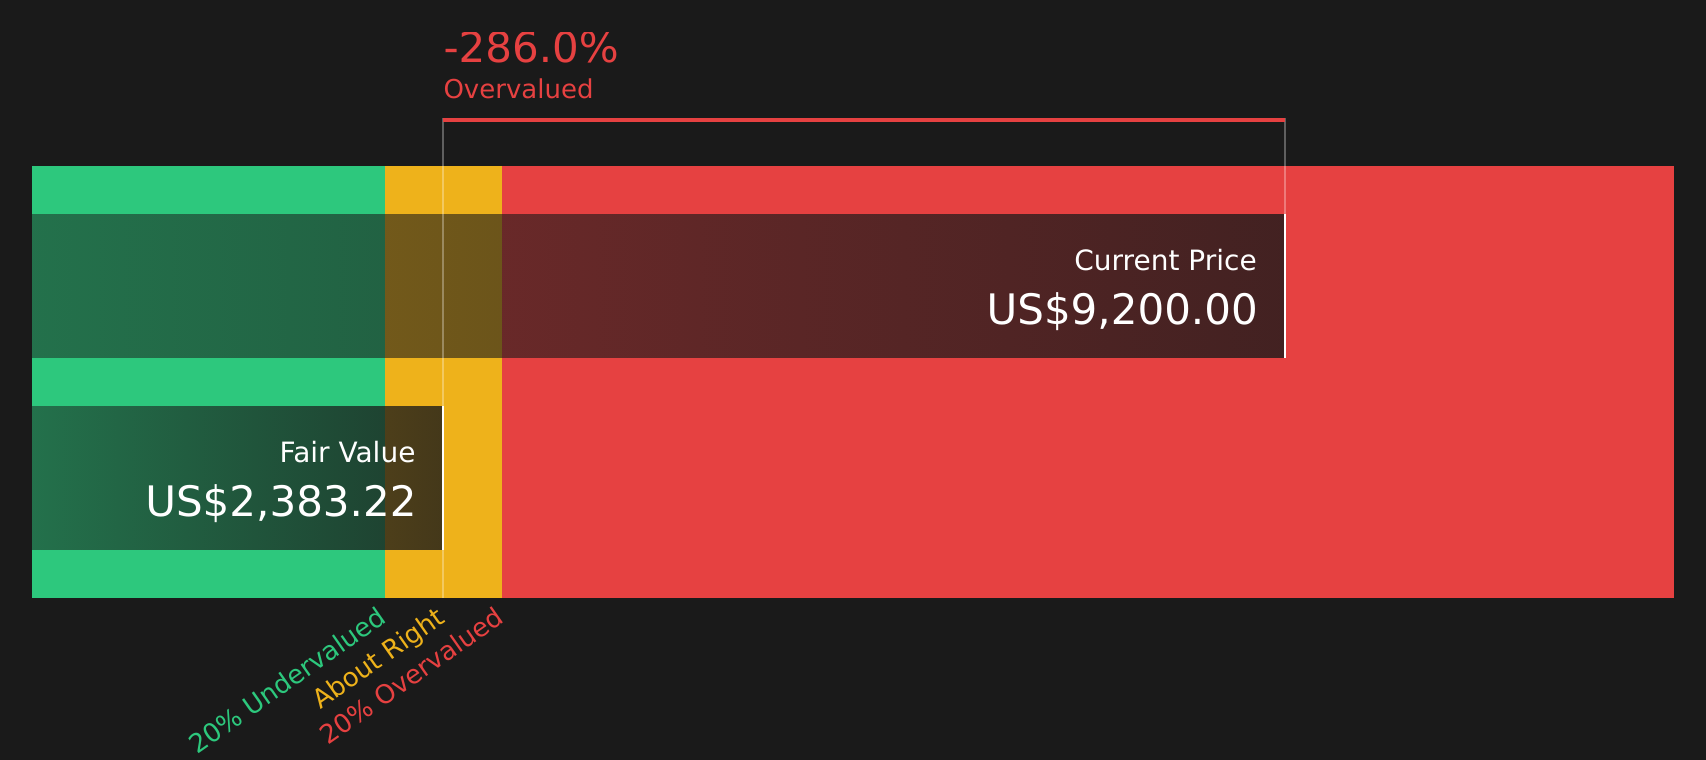
Simply Wall St performs a discounted cash flow (DCF) on every stock in the world every day (check out Farmers & Merchants Bank of Long Beach for example). We show the entire calculation in full. You can track the result in your watchlist or portfolio and be alerted when this changes, or use our stock screener to discover 44 high quality undervalued stocks. If you save a screener we even alert you when new companies match - so you never miss a potential opportunity.
Next Steps
With Farmers & Merchants Bank of Long Beach attracting both optimism and concern, it makes sense to review the underlying data yourself and decide how the current pricing aligns with your risk tolerance and return expectations. You can then weigh both sides of the story by checking the 2 key rewards and 2 important warning signs
Looking for more investment ideas beyond Farmers & Merchants Bank of Long Beach?
If the recent moves at Farmers & Merchants Bank of Long Beach have sharpened your focus, now is a good time to widen your watchlist with fresh ideas.
- Target stability first by reviewing companies highlighted in the 73 resilient stocks with low risk scores that may better fit a cautious approach to market swings.
- Seek strong fundamentals by scanning stocks in the solid balance sheet and fundamentals stocks screener (47 results) that pair financial resilience with cleaner balance sheets.
- Hunt for overlooked potential by checking the screener containing 18 high quality undiscovered gems before the wider market pays closer attention.
This article by Simply Wall St is general in nature. We provide commentary based on historical data and analyst forecasts only using an unbiased methodology and our articles are not intended to be financial advice. It does not constitute a recommendation to buy or sell any stock, and does not take account of your objectives, or your financial situation. We aim to bring you long-term focused analysis driven by fundamental data. Note that our analysis may not factor in the latest price-sensitive company announcements or qualitative material. Simply Wall St has no position in any stocks mentioned.