FB Financial (FBK) Net Interest Margin Resilience Tests Bullish Narratives In Q4 2025 Results
FB Financial Corporation FBK | 53.41 | +1.48% |
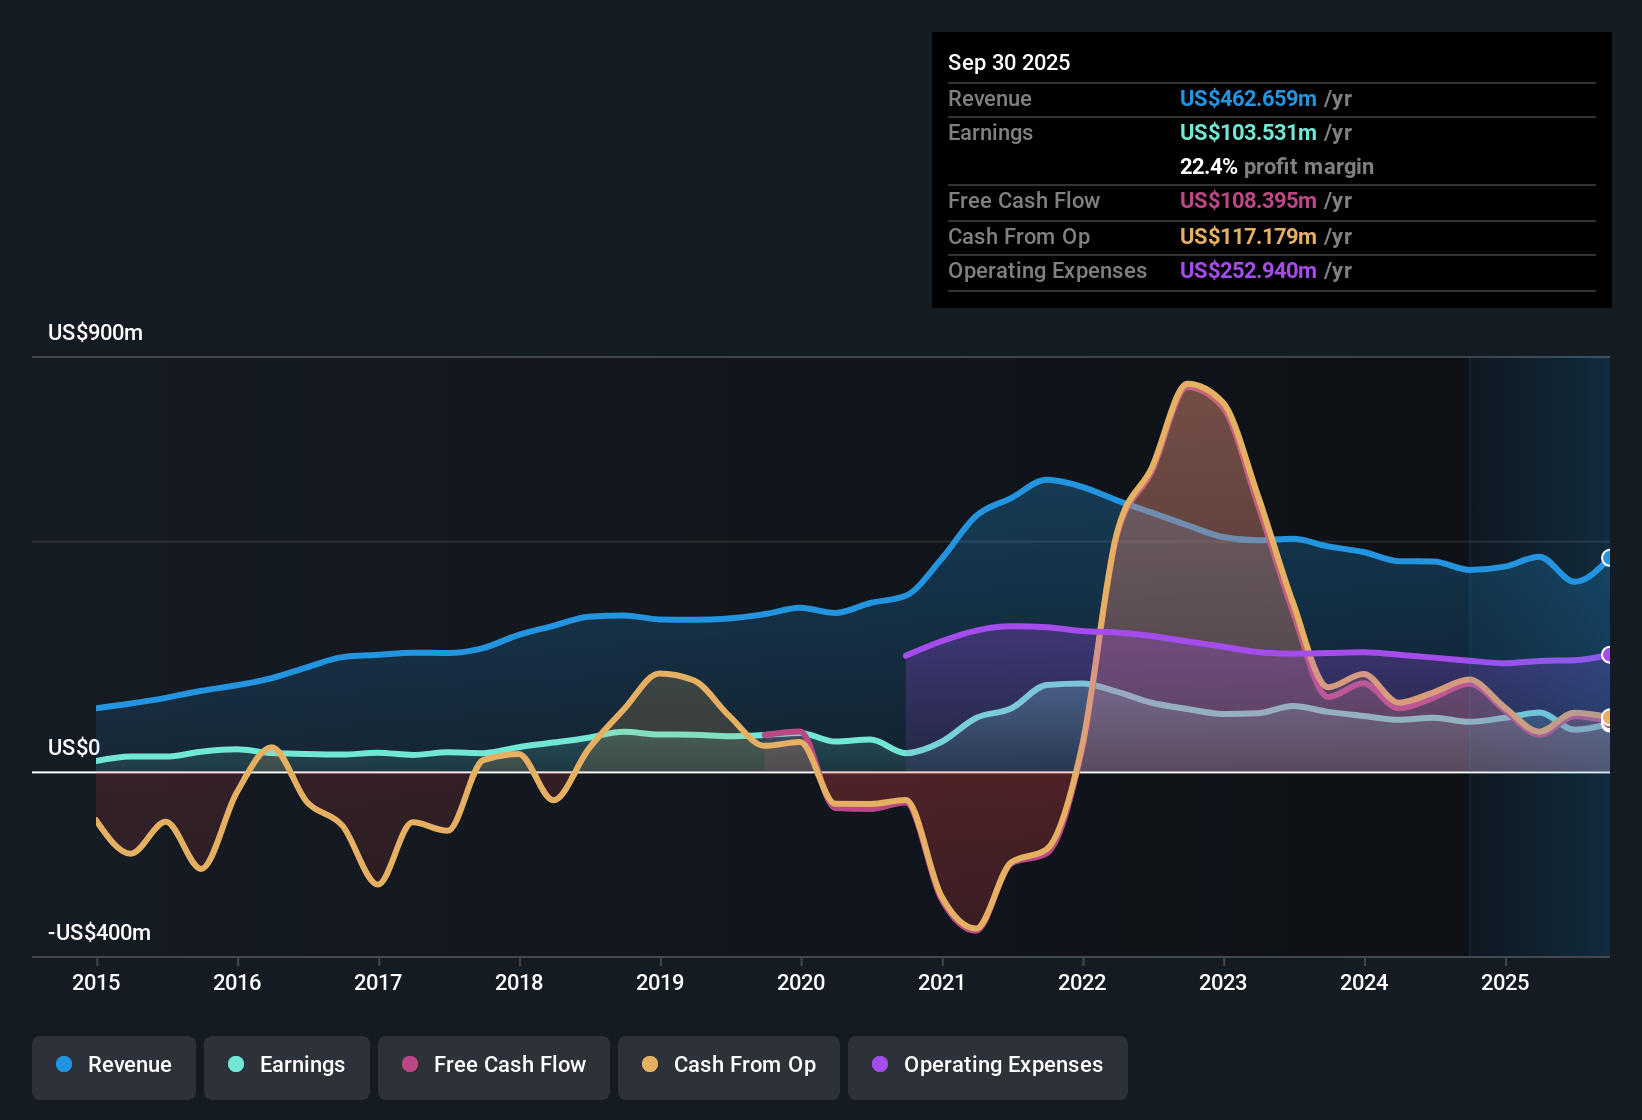
FB Financial (FBK) has just closed out FY 2025 with Q4 revenue of US$177.4 million and basic EPS of US$1.08, setting a clear earnings marker for investors to work from. Over the past year, the company has seen quarterly revenue move from US$123.3 million in Q4 2024 to US$177.4 million in Q4 2025, while basic EPS over the same quarters went from US$0.81 to US$1.08. Trailing twelve month EPS sits at US$2.47 on revenue of US$516.7 million. With a current net profit margin of 23.7% compared with 26.2% a year earlier, the story now turns to how investors weigh growth potential against a softer margin profile.
See our full analysis for FB Financial.With the headline numbers on the table, the next step is to see how these results line up with the widely held narratives about FB Financial, and where the fresh data may confirm or challenge what the market has been assuming.
Loan book reaches about US$12.4b with higher non performing loans
- Total loans ended FY 2025 at US$12.4b, up from US$9.6b in Q4 2024, while non performing loans moved from US$115.1 million to US$148.6 million over the same comparison.
- For a bullish view on regional growth, what stands out is that the larger loan book sits alongside higher non performing loans, with TTM net income of US$122.6 million and a net profit margin of 23.7%. This gives bulls solid profitability today, but also gives bears a clear credit quality metric to watch.
Margins hold as costs stay in mid 50s
- On a trailing twelve month basis, FB Financial reported a net interest margin of 3.81% and a cost to income ratio of 56.4%, compared with point in time quarterly cost to income figures during FY 2025 that ranged from 53.3% to 59.9%.
- Supporters with a bullish stance can point out that a 3.81% net interest margin and TTM revenue of US$516.7 million align with the view of a full service regional bank benefiting from its footprint across several Southeastern states. Yet the fact that quarterly cost to income stayed in the 50% to 60% area means the bullish story still has to account for ongoing expense intensity rather than assuming easy efficiency gains.
- Net income on a TTM basis of US$122.6 million and TTM basic EPS of US$2.47 back up the idea of high earnings quality in the data provided, which strongly supports the bullish case built around steady banking operations.
- At the same time, the move in quarterly cost to income from 59.9% in Q1 2025 to 56.3% in Q4 2025 shows some variability that bullish investors need to balance against the simple headline that margins look solid at the group level.
Premium 25.6x P/E versus peers and DCF gap
- FB Financial is shown with a trailing P/E of 25.6x versus a US banks industry average of 12.1x and a peer average of 10.1x, while the current share price of US$60.75 sits about 40.5% below the stated DCF fair value of US$102.08.
- Critics with a bearish tilt often focus on that 25.6x multiple as evidence of a rich valuation. Yet the same data set includes a DCF fair value well above the current price and five year earnings that declined by 5.2% per year alongside a 5.7% one year earnings rise, creating a tension where the bearish concern about paying up at a premium multiple has to be weighed against both the DCF gap and the recent improvement in TTM revenue to US$516.7 million and net income to US$122.6 million.
- The contrast between the share price of US$60.75 and the DCF fair value of US$102.08 challenges a simple bearish claim that the premium P/E alone signals overpricing, because the cash flow based reference points in a different direction.
- At the same time, the history of earnings shrinking by 5.2% per year over five years alongside margins easing from 26.2% to 23.7% over the latest year supports the cautious side of the bearish view that past profit trends have not been straightforward.
Next Steps
Don't just look at this quarter; the real story is in the long-term trend. We've done an in-depth analysis on FB Financial's growth and its valuation to see if today's price is a bargain. Add the company to your watchlist or portfolio now so you don't miss the next big move.
See What Else Is Out There
FB Financial carries a premium 25.6x P/E alongside a softer net profit margin and higher non performing loans, which may leave you questioning the trade off between price and business quality.
If that combination of higher pricing and credit quality pressure makes you uneasy, use our CTA_SCREENER_HIGH_ROE_LOW_DEBT to quickly focus on companies pairing strong profitability with modest leverage and potentially sturdier earnings power.
This article by Simply Wall St is general in nature. We provide commentary based on historical data and analyst forecasts only using an unbiased methodology and our articles are not intended to be financial advice. It does not constitute a recommendation to buy or sell any stock, and does not take account of your objectives, or your financial situation. We aim to bring you long-term focused analysis driven by fundamental data. Note that our analysis may not factor in the latest price-sensitive company announcements or qualitative material. Simply Wall St has no position in any stocks mentioned.