Ferrari (NYSE:RACE) Valuation Check After Sharp 1 Day Share Price Rebound
Ferrari NV RACE | 358.13 | +0.84% |
Recent Share Performance and Business Snapshot
Ferrari (NYSE:RACE) shares closed at $363.22, with a 1 day return of 8.1% and a 7 day return of 10.0%, while the stock shows negative moves over the past month and past 3 months.
Over longer horizons, Ferrari’s total return is negative over the past year but positive over the past 3 years and 5 years. Reported revenue stands at €7,146.0, with net income of €1,600.0, alongside annual revenue and net income growth figures that remain in positive territory.
The sharp 8.1% 1 day share price return and 10.0% 7 day share price return come after a period of weaker recent momentum, with the 1 year total shareholder return of 22.9% contrasting with solid 3 and 5 year total shareholder returns.
If this kind of rebound has you thinking about where else capital is moving in the market, it could be a good time to check out 23 top founder-led companies as potential next ideas.
With Ferrari shares rebounding in the short term, showing a 1 year total return of 22.9%, and trading below the average analyst price target, the key question is whether there is still a buying opportunity or if the market is already pricing in future growth.
Most Popular Narrative: 15.9% Undervalued
Ferrari's widely followed narrative pegs fair value at $431.78, meaning it sits above the last close of $363.22 and frames the recent pullback in a different light.
The analyst price target for Ferrari has been revised modestly lower, with fair value moving from about €441.39 to €431.78 as analysts factor in lower external price targets, a slightly higher discount rate, and updated assumptions on growth, margins, and future P/E multiples.
Valuation Changes
• Fair Value: revised modestly lower from about €441.39 to about €431.78, a reduction of around €9.61.
• Discount Rate: nudged higher from about 14.47% to about 14.78%, implying a slightly more conservative stance on risk.
• Revenue Growth: adjusted marginally higher from about 6.50% to about 6.56%, a very small uplift in projected top line expansion.
• Net Profit Margin: moved slightly higher from about 23.50% to about 23.59%, reflecting a small tweak in long term profitability assumptions.
• Future P/E: trimmed from about 49.21x to about 47.63x, indicating a slightly lower multiple applied to Ferrari's expected earnings.
Want to see what sits behind that higher fair value tag? Revenue pacing, margin tweaks and a premium future earnings multiple all play a part, but the exact mix might surprise you.
Result: Fair Value of $431.78 (UNDERVALUED)
However, there are pressure points to keep in mind, including a crowded 2025 launch slate that could dilute exclusivity, as well as ongoing supply chain and cost headwinds.
Another Angle On Ferrari’s Valuation
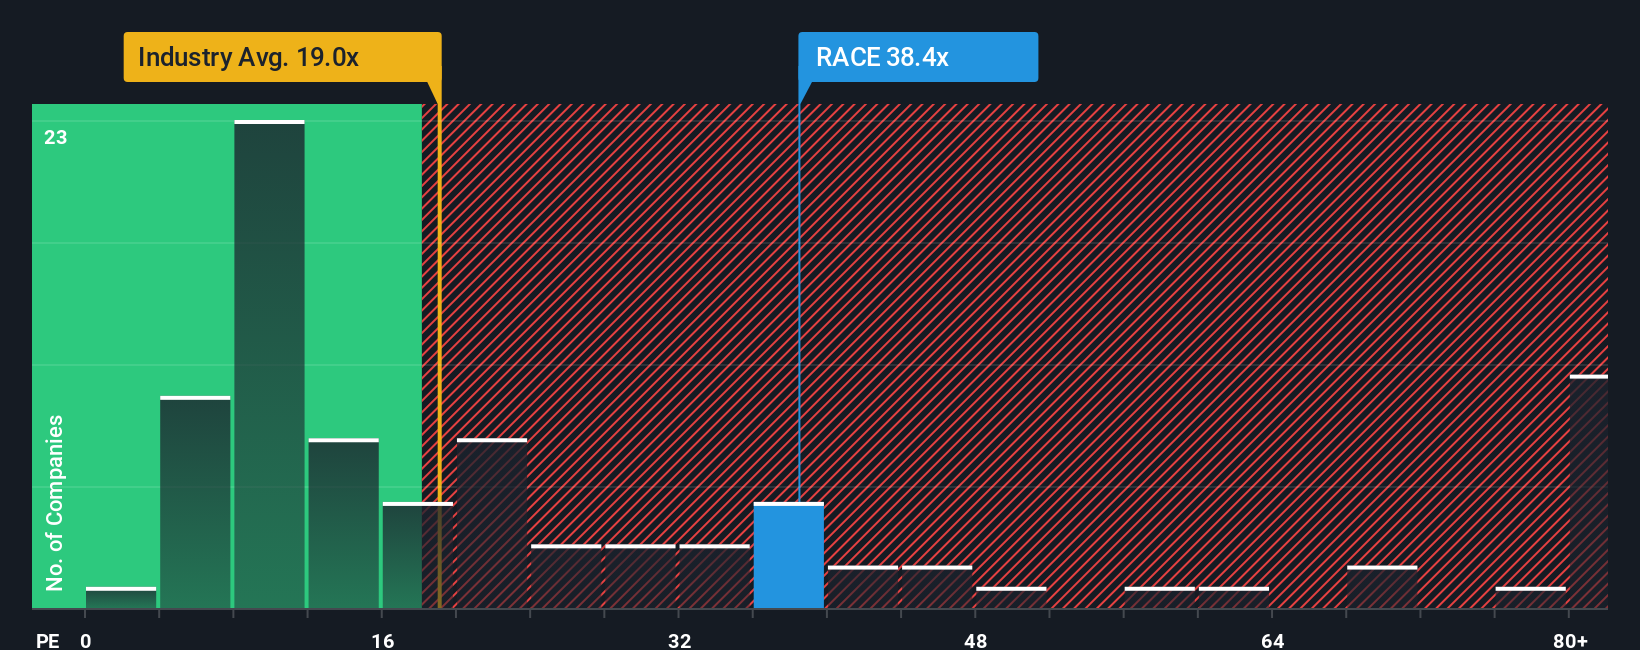
That $431.78 fair value narrative points to upside, but the current P/E of 34.3x tells a different story. It sits well above the global auto industry at 20.1x, its peer average at 21.2x, and even the fair ratio of 17.6x. This suggests meaningful valuation risk if sentiment cools. Which signal do you weigh more heavily?
Build Your Own Ferrari Narrative
If you see the numbers differently or prefer to test your own assumptions, you can build a full Ferrari view in a few minutes, starting with Do it your way.
A good starting point is our analysis highlighting 2 key rewards investors are optimistic about regarding Ferrari.
Looking for more investment ideas?
If Ferrari has sharpened your focus, do not stop here. Use the Simply Wall St screener to spot other opportunities that could fit your style and risk comfort.
- Target value first and see which companies stand out on price and quality through our 51 high quality undervalued stocks built from the screener.
- Strengthen your search for stability by filtering for companies with resilient finances using the solid balance sheet and fundamentals stocks screener (45 results) identified by the screener.
- Seek income potential and shortlist companies offering higher yields with the 14 dividend fortresses that our screener currently highlights.
This article by Simply Wall St is general in nature. We provide commentary based on historical data and analyst forecasts only using an unbiased methodology and our articles are not intended to be financial advice. It does not constitute a recommendation to buy or sell any stock, and does not take account of your objectives, or your financial situation. We aim to bring you long-term focused analysis driven by fundamental data. Note that our analysis may not factor in the latest price-sensitive company announcements or qualitative material. Simply Wall St has no position in any stocks mentioned.