Fidelity National Financial (FNF) Stock After Recent Pullback Are Current Levels Attractive
Fidelity National Financial, Inc. - FNF Group FNF | 0.00 |
- Investors may be wondering whether Fidelity National Financial at around US$47.92 is offering good value right now, or if they might be paying up for the stock.
- The share price has inched up around 1.1% over the past week and 0.9% over the past month, yet is still down 11.7% year to date and 6.6% over the last year. This may have shifted how investors think about both its growth potential and risk profile.
- Over the past few months, investors have been focused on broader sector trends in insurance and real estate related activity, as well as company specific updates around operations and capital allocation. These factors help frame the recent share price moves and provide context for why the longer term returns of 58.3% over three years and 43.8% over five years sit alongside a weaker recent share price.
- On Simply Wall St's valuation checks, Fidelity National Financial scores 2 out of 6. The stock appears undervalued on 2 of the 6 measures, which sets up a closer look at different valuation methods next and an even deeper way of thinking about value at the end of this article.
Fidelity National Financial scores just 2/6 on our valuation checks. See what other red flags we found in the full valuation breakdown.
Approach 1: Fidelity National Financial Excess Returns Analysis
The Excess Returns model looks at how much value a company may create above the required return that shareholders expect. It starts with the equity invested in the business, then compares the earnings that equity generates with the cost of that equity.
For Fidelity National Financial, the model uses a Book Value of $26.97 per share and a Stable EPS of $2.77 per share, based on the median return on equity from the past five years. The implied Cost of Equity is $1.92 per share, which leads to an Excess Return of $0.85 per share. This is built on an Average Return on Equity of 10.26% and a Stable Book Value of $26.97 per share, using median figures from the past five years as anchors.
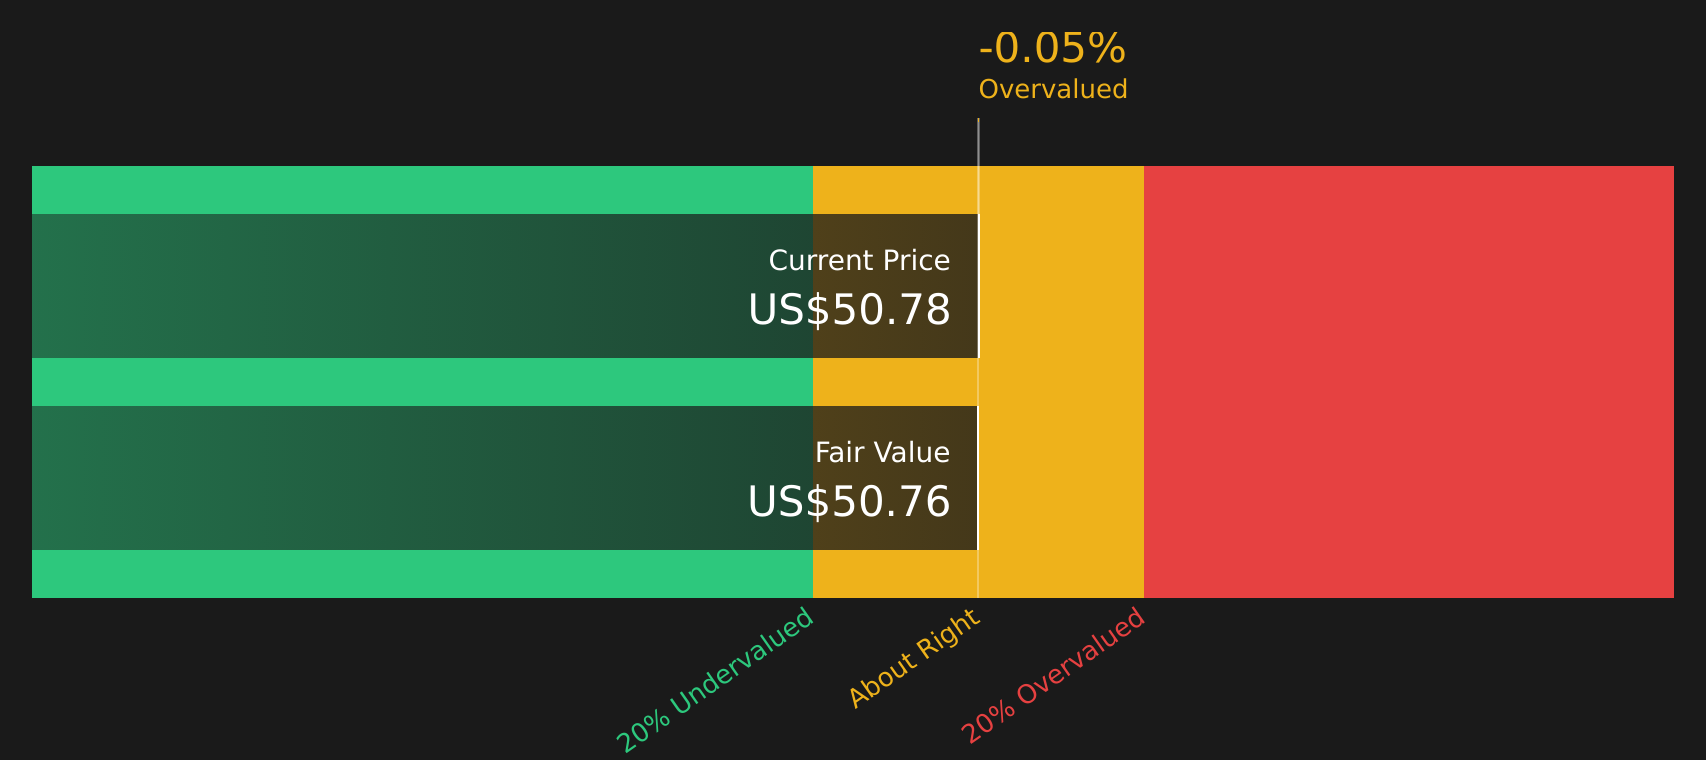
By projecting these excess returns forward and discounting them, the Excess Returns model arrives at an estimated intrinsic value of about $50.76 per share. Compared with the current share price of around $47.92, the model suggests the stock is about 5.6% undervalued, which is within a relatively tight range.
Result: ABOUT RIGHT
Fidelity National Financial is fairly valued according to our Excess Returns, but this can change at a moment's notice. Track the value in your watchlist or portfolio and be alerted on when to act.
Approach 2: Fidelity National Financial Price vs Earnings
P/E is a common way to think about value for profitable companies, because it links what you pay for each share to the earnings that share generates. A higher or lower P/E often reflects what the market expects from a company, as well as how risky those earnings might be.
For Fidelity National Financial, the current P/E is 16.93x. That sits above the Insurance industry average of 11.34x and above the peer average of 14.13x, which suggests investors are currently paying a higher price for each dollar of earnings than for the broader group.
Simply Wall St’s Fair Ratio for Fidelity National Financial is 16.21x. This is a proprietary estimate of what a reasonable P/E might be, given factors such as the company’s earnings profile, its industry, profit margins, market cap and key risks. Because it is tailored to the company’s specific characteristics rather than just broad peer or industry comparisons, it can give a more nuanced view of whether the current P/E looks stretched or conservative.
With the actual P/E of 16.93x compared with the Fair Ratio of 16.21x, the stock appears slightly expensive on this measure.
Result: OVERVALUED

P/E ratios tell one story, but what if the real opportunity lies elsewhere? Start investing in legacies, not executives. Discover our 20 top founder-led companies.
Upgrade Your Decision Making: Choose your Fidelity National Financial Narrative
Earlier the article mentioned that there is an even better way to understand valuation. Narratives bring your view of Fidelity National Financial together with a simple forecast by letting you attach a story about the business to your assumptions for future revenue, earnings and margins. They then link that to a Fair Value you can compare with today’s share price on Simply Wall St’s Community page, where Narratives are updated as new news or earnings arrive. Different investors can reasonably land at very different views, such as a more optimistic US$70.00 fair value that leans on AI driven margin gains and a growing fee based F&G segment, or a more cautious US$50.00 fair value that leans on concerns about title sector competition, costs and regulation.
Do you think there's more to the story for Fidelity National Financial? Head over to our Community to see what others are saying!

This article by Simply Wall St is general in nature. We provide commentary based on historical data and analyst forecasts only using an unbiased methodology and our articles are not intended to be financial advice. It does not constitute a recommendation to buy or sell any stock, and does not take account of your objectives, or your financial situation. We aim to bring you long-term focused analysis driven by fundamental data. Note that our analysis may not factor in the latest price-sensitive company announcements or qualitative material. Simply Wall St has no position in any stocks mentioned.