

First Community And 2 Other Stocks Estimated To Be Trading Below Their Intrinsic Value
Bowhead Specialty Holdings Inc. BOW | 0.00 |
The United States market has remained flat over the last week, yet it is up 19% over the past year with earnings expected to grow by 18% per annum in the coming years. In this context, identifying stocks that are trading below their intrinsic value can be a strategic move for investors seeking potential opportunities amidst steady market conditions.
Top 10 Undervalued Stocks Based On Cash Flows In The United States
| Name | Current Price | Fair Value (Est) | Discount (Est) |
| Rayonier (RYN) | $21.45 | $42.72 | 49.8% |
| Q2 Holdings (QTWO) | $52.66 | $103.06 | 48.9% |
| Procore Technologies (PCOR) | $44.03 | $87.02 | 49.4% |
| Janus Living (JAN) | $29.13 | $57.58 | 49.4% |
| FatPipe (FATN) | $4.96 | $9.91 | 49.9% |
| Capri Holdings (CPRI) | $17.47 | $34.08 | 48.7% |
| Betterware de MéxicoP.I. de (BWMX) | $18.23 | $36.26 | 49.7% |
| Beacon Financial (BBT) | $30.19 | $59.59 | 49.3% |
| Amaroq (AMRQ.F) | $1.144 | $2.23 | 48.8% |
| AAON (AAON) | $112.19 | $221.52 | 49.4% |
Let's dive into some prime choices out of the screener.
First Community (FCCO)
Overview: First Community Corporation, with a market cap of $304.31 million, operates as the bank holding company for First Community Bank, offering a range of commercial and retail banking products and services to small-to-medium sized businesses, professionals, and individuals.
Operations: The company's revenue is primarily derived from Commercial and Retail Banking ($65.40 million), followed by Mortgage Banking ($9.49 million), Investment Advisory and Non-Deposit services ($8.03 million), and the Corporate Segment ($6.81 million).
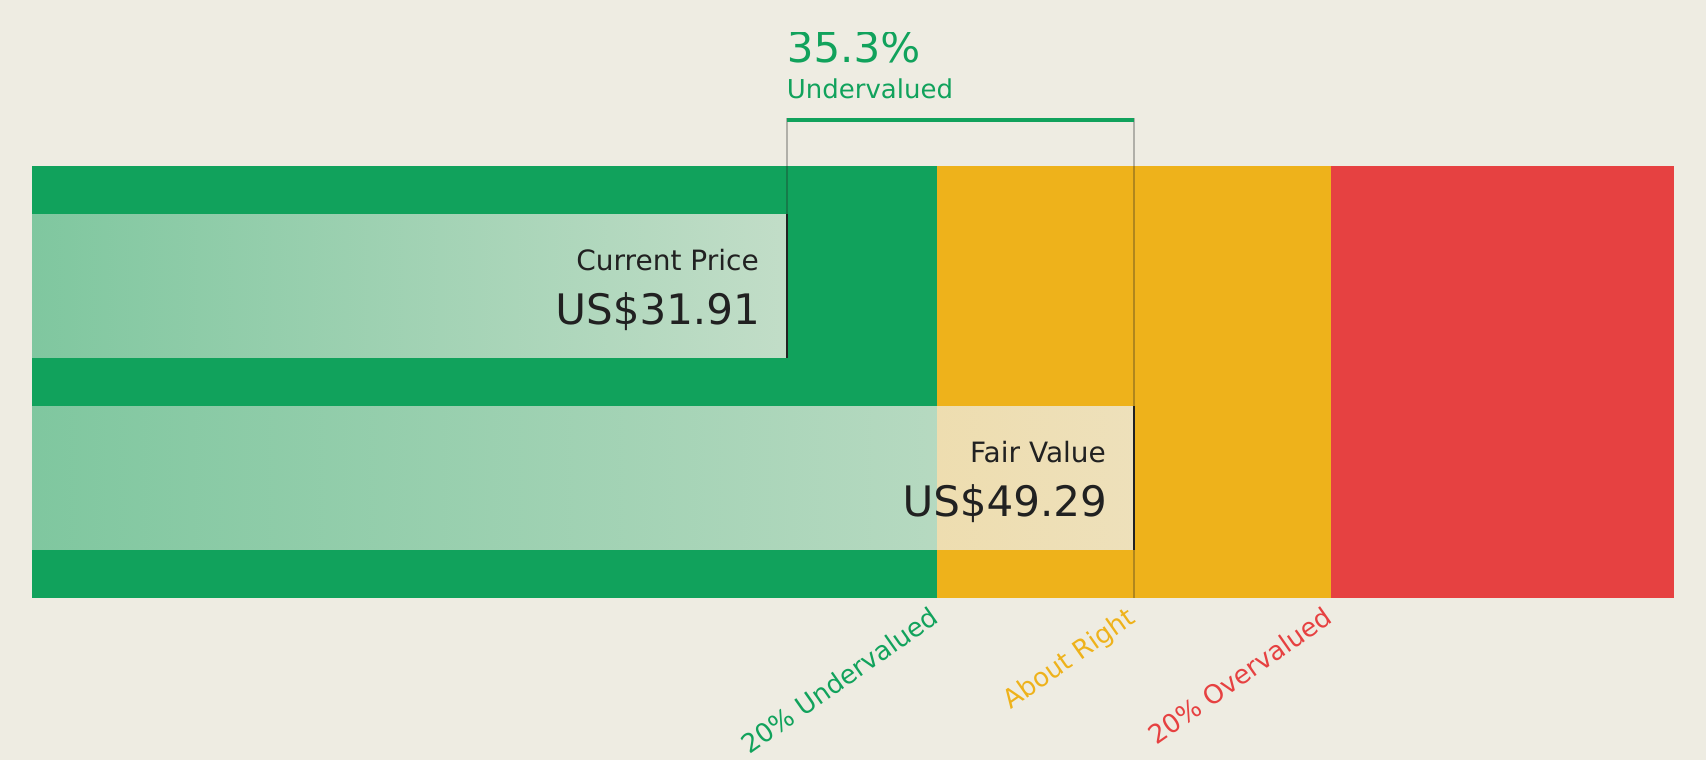
Estimated Discount To Fair Value: 33.9%
First Community appears undervalued, trading at US$32.58, below its estimated future cash flow value of US$49.29. Despite being dropped from several Russell indices in June 2026, the company maintains strong fundamentals with a forecasted earnings growth of 20.8% annually, outpacing the US market average of 18.2%. Recent earnings reports show net income rising to US$5.5 million for Q1 2026, alongside a reliable dividend yield of 1.96%.
Heritage Financial (HFWA)
Overview: Heritage Financial Corporation is the bank holding company for Heritage Bank, offering a range of financial services to small and medium-sized businesses and their owners in the United States, with a market cap of approximately $1.21 billion.
Operations: The company generates revenue primarily through its commercial banking segment, which amounts to $265.58 million.
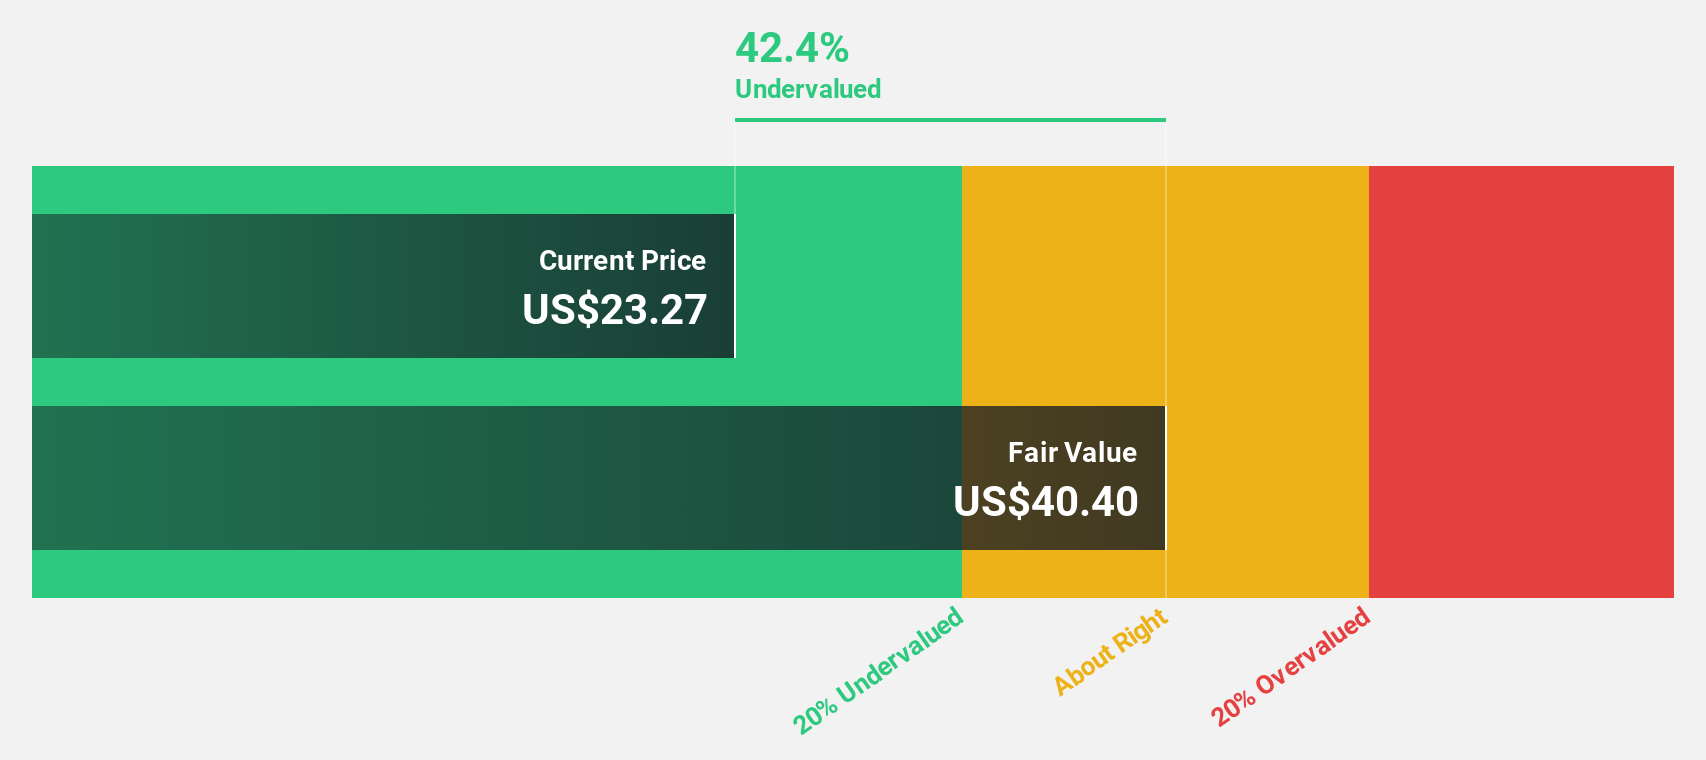
Estimated Discount To Fair Value: 26.8%
Heritage Financial is trading at US$29.81, significantly below its estimated future cash flow value of US$40.73, indicating undervaluation. Recent earnings showed net interest income rising to US$69.22 million and net income to US$18.95 million for Q1 2026, reflecting strong growth despite increased net charge-offs of $552,000. However, insider selling and a history of shareholder dilution are concerns amidst forecasts for substantial annual earnings growth of 27.72%, outpacing the broader market.
Bowhead Specialty Holdings (BOW)
Overview: Bowhead Specialty Holdings Inc. offers commercial specialty property and casualty insurance products in the United States and has a market cap of $1.03 billion.
Operations: The company generates revenue of $584.57 million from its commercial specialty property and casualty insurance products in the United States.
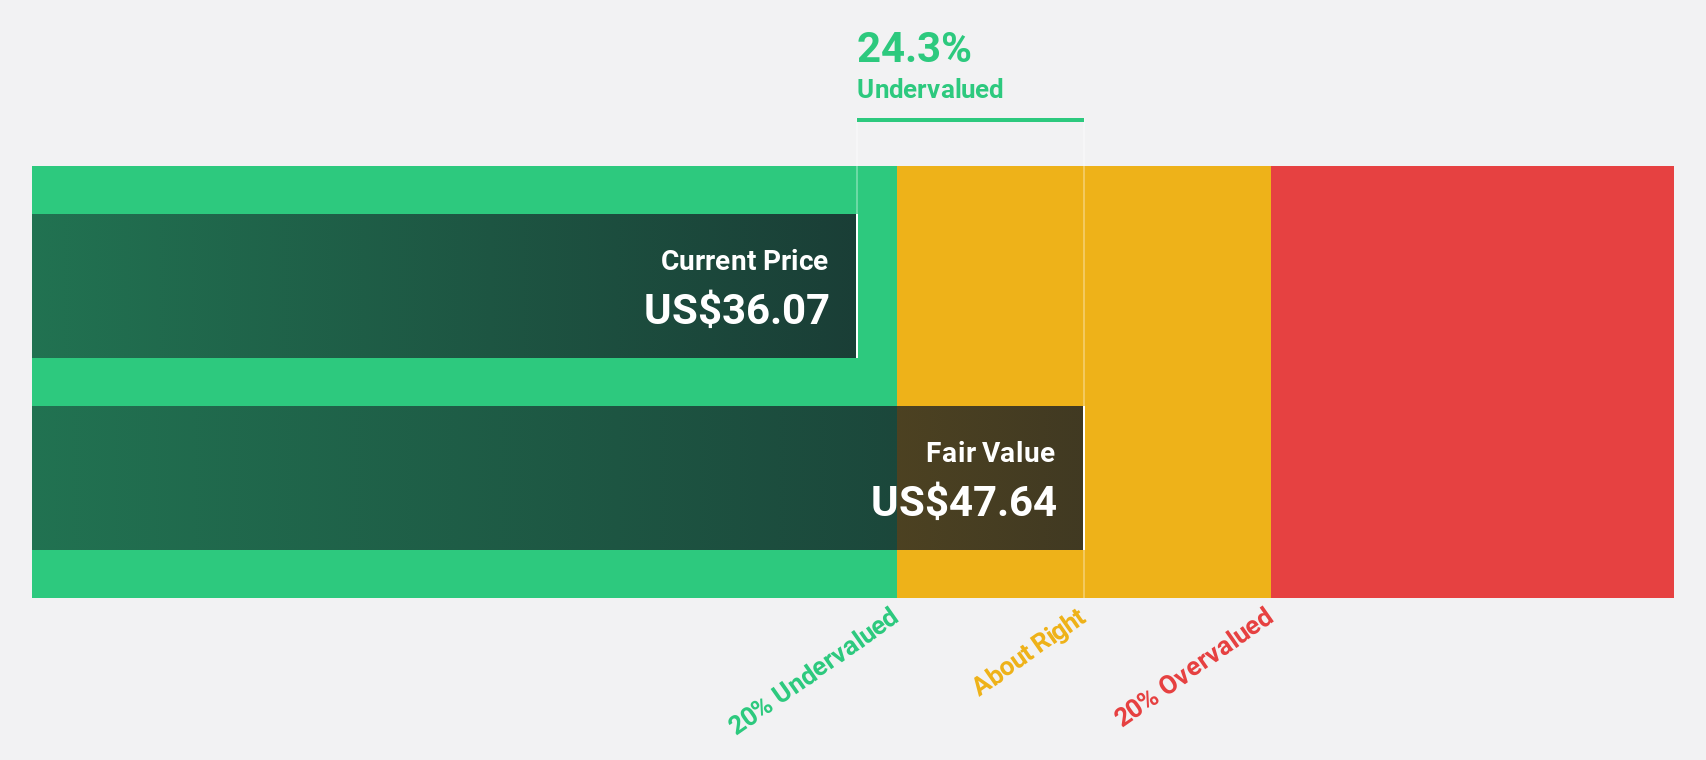
Estimated Discount To Fair Value: 39.9%
Bowhead Specialty Holdings, priced at US$31.57, is undervalued with a future cash flow estimate of US$52.5. Recent earnings for Q1 2026 showed revenue growth to US$155.69 million and net income rising to US$16.01 million from the previous year, highlighting strong performance despite being dropped from several growth indices and added to value indices like Russell 3000 Value Benchmark, reflecting its shift towards value investing appeal amidst significant forecasted earnings growth of over 20% annually.
Where To Now?
- Click here to access our complete index of 146 Undervalued US Stocks Based On Cash Flows.
- Invested in any of these stocks? Simplify your portfolio management with Simply Wall St and stay ahead with our alerts for any critical updates on your stocks.
- Invest smarter with the free Simply Wall St app providing detailed insights into every stock market around the globe.
Seeking Other Investments?
- Explore high-performing small cap companies that haven't yet garnered significant analyst attention.
- Diversify your portfolio with solid dividend payers offering reliable income streams to weather potential market turbulence.
- Fuel your portfolio with companies showing strong growth potential, backed by optimistic outlooks both from analysts and management.
This article by Simply Wall St is general in nature. We provide commentary based on historical data and analyst forecasts only using an unbiased methodology and our articles are not intended to be financial advice. It does not constitute a recommendation to buy or sell any stock, and does not take account of your objectives, or your financial situation. We aim to bring you long-term focused analysis driven by fundamental data. Note that our analysis may not factor in the latest price-sensitive company announcements or qualitative material. Simply Wall St has no position in any stocks mentioned.