

First National Bank Alaska (FBAK), What Is Behind The Fresh Attention?
FIRST NATIONAL BANK ALASKA FBAK | 0.00 |
First National Bank Alaska (FBAK) has drawn fresh attention after reporting half year net income of US$41.99 million and affirming a US$4.00 per share cash dividend for shareholders.
First National Bank Alaska shares last closed at US$334.99, with a 30 day share price return of 4.68% and a year to date share price return of 13.94%. The 1 year total shareholder return of 31.27% and 3 year total shareholder return of 117.57% indicate that momentum has built steadily over time as investors react to earnings and dividend updates.
If you are comparing First National Bank Alaska with other potential opportunities, it could be a useful time to broaden your search and check out 19 top founder-led companies
Bulls point to First National Bank Alaska's strong recent returns and steady dividend, while bears question how much of that strength is already reflected in the current price. Do the numbers still support the optimistic view as valuation comes into focus?
Price-to-Earnings of 12.7x: Is it justified?
On the surface, First National Bank Alaska trades on a P/E of 12.7x, which aligns with a share price of $334.99 and screens as good value against selected peers.
The P/E ratio compares the current share price to the bank's earnings per share, so it effectively shows how many dollars investors are paying for each dollar of earnings. For a bank like First National Bank Alaska, this is a simple way to see how the market is weighing its profit profile and earnings consistency.
According to the data, FBAK's P/E of 12.7x looks attractive relative to a peer average of 20.6x. That suggests the market is assigning a lower price tag to each dollar of FBAK earnings compared with those peers, despite high quality earnings and profit growth of 8% per year over the past 5 years.
The comparison shifts when you look at the broader US Banks industry, where the average P/E stands at 12x. On that yardstick, First National Bank Alaska trades at a small premium to the typical US bank, even though its current earnings growth over the past year of 12.7% did not outpace the Banks industry figure of 23.3%. That mix of a discount to selected peers but a modest premium to the wider industry makes the P/E level an important focal point for valuation work.
Result: Price-to-Earnings of 12.7x (ABOUT RIGHT)
However, you still need to consider that First National Bank Alaska is closely tied to the Alaskan economy and operates with a relatively concentrated geographic footprint.
Another view on First National Bank Alaska valuation
The P/E comparison presents First National Bank Alaska as roughly fairly priced, but a different picture appears when using the SWS DCF model. Under this approach, the estimated future cash flow value is $454.40 per share, compared with the current $334.99 price, which may indicate undervaluation. Which lens do you want to rely on most?
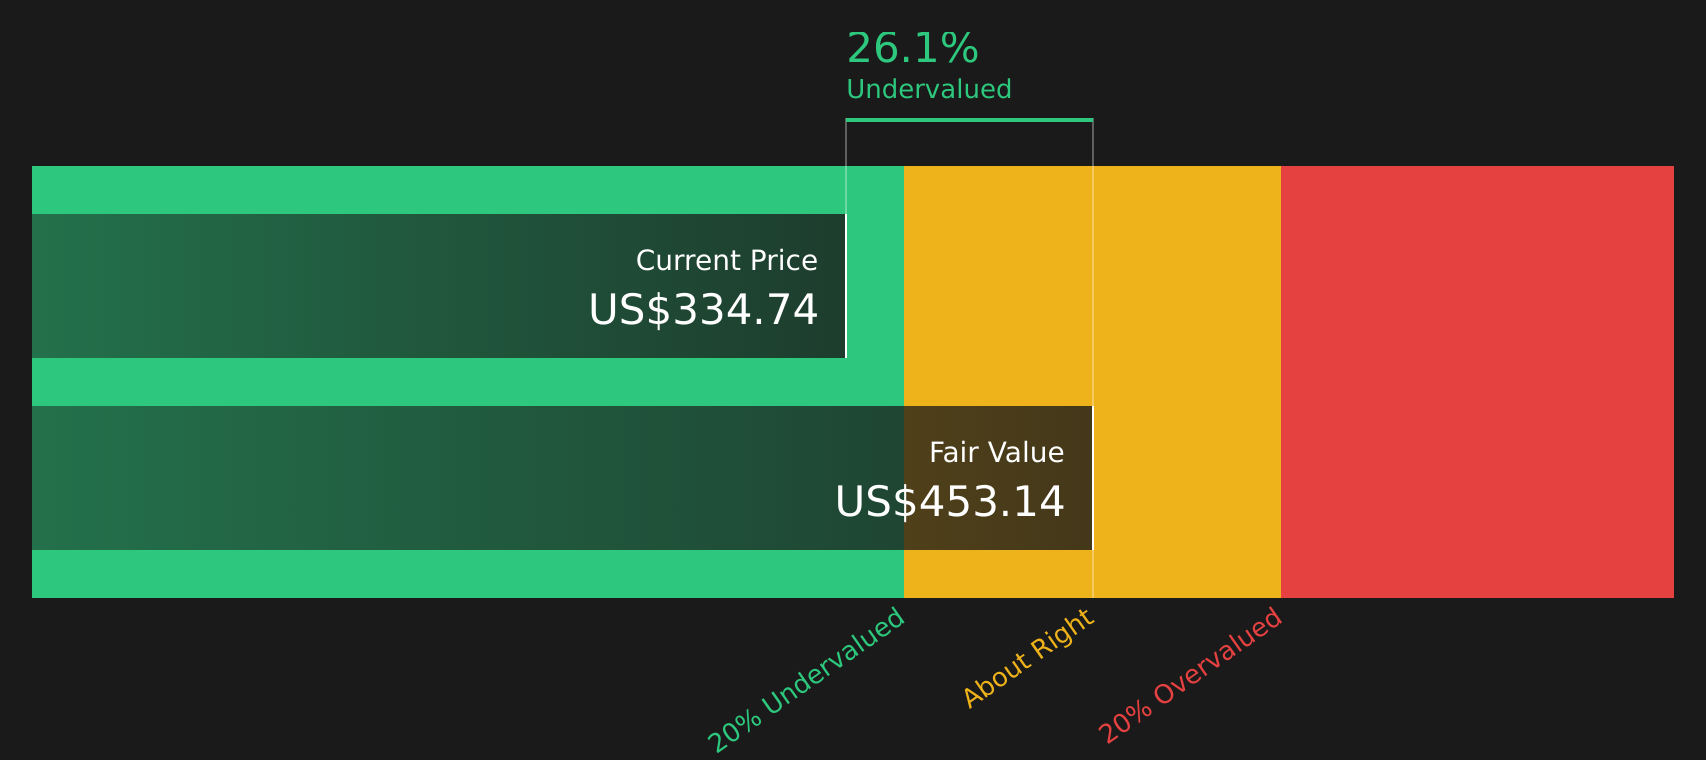
Simply Wall St performs a discounted cash flow (DCF) on every stock in the world every day (check out First National Bank Alaska for example). We show the entire calculation in full. You can track the result in your watchlist or portfolio and be alerted when this changes, or use our stock screener to discover 49 high quality undervalued stocks. If you save a screener we even alert you when new companies match - so you never miss a potential opportunity.
Next Steps
With sentiment split between First National Bank Alaska's recent returns and questions about valuation, now is a good time to look through the details yourself. To balance both the potential upsides and the issues investors are watching, take a closer look at the 2 key rewards and 1 important warning sign.
Looking for more investment ideas beyond First National Bank Alaska?
If First National Bank Alaska has your attention, do not stop there. Use the wider market to pressure test your thinking and spot fresh opportunities.
- Scan for companies that combine strong financial footing with resilience by checking the solid balance sheet and fundamentals stocks screener (49 results).
- Hunt for potential value opportunities that balance quality and price through the 49 high quality undervalued stocks.
- Target stocks that aim to manage risk more tightly and keep volatility in check by reviewing the 85 resilient stocks with low risk scores.
This article by Simply Wall St is general in nature. We provide commentary based on historical data and analyst forecasts only using an unbiased methodology and our articles are not intended to be financial advice. It does not constitute a recommendation to buy or sell any stock, and does not take account of your objectives, or your financial situation. We aim to bring you long-term focused analysis driven by fundamental data. Note that our analysis may not factor in the latest price-sensitive company announcements or qualitative material. Simply Wall St has no position in any stocks mentioned.