Fiserv (FISV) Margin Expansion Story Tested By 1.4% Revenue Growth
Fiserv, Inc. FISV | 56.16 | +1.28% |
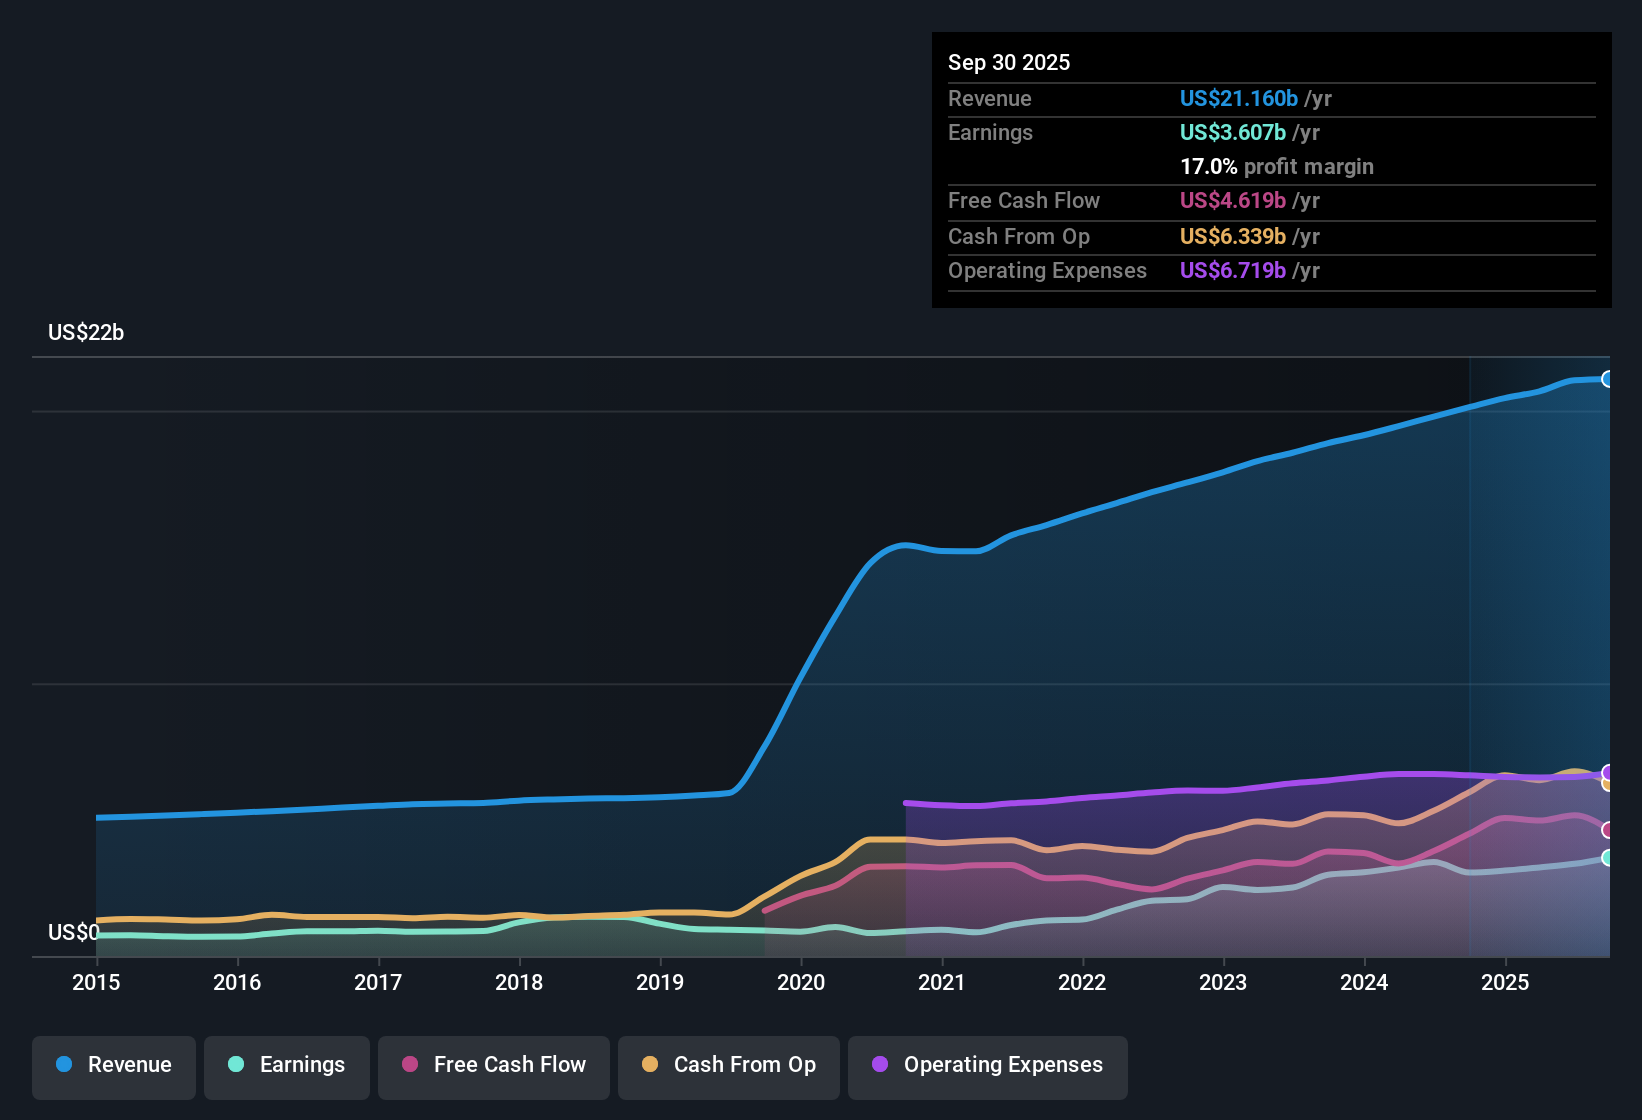
Fiserv (FISV) has wrapped up FY 2025 with fourth quarter revenue of US$5.3b and basic EPS of US$1.51, alongside trailing twelve month revenue of US$21.2b and EPS of US$6.34 that frame the full year picture. Over recent periods the company has seen quarterly revenue range from US$5.1b to US$5.5b, while basic EPS has moved between US$0.98 and US$1.86. This gives you a clear view of how the top line and per share earnings have tracked into the latest print. With a trailing net margin of 16.4% and earnings described as high quality, this set of results puts profitability squarely in focus for investors weighing the trade off between growth and earnings power.
See our full analysis for Fiserv.With the headline numbers on the table, the next step is to see how this earnings profile lines up with the most widely held narratives about Fiserv, and where those stories might need a rethink.
Margins Hold At 16.4% With Mixed EPS Trend
- On a trailing basis, Fiserv earned US$3.5b of net income on US$21.2b of revenue, which lines up with a 16.4% net margin and FY 2025 basic EPS of US$6.34 across the last four quarters.
- What stands out for the bullish view is that earnings grew 11.1% over the last year while the net margin moved from 15.3% to 16.4%. However, quarterly EPS within FY 2025 ranged from US$1.47 to US$1.86, so bulls looking for smooth, accelerating profit trends need to reconcile that bumpiness with their expectation of much higher margins and earnings by 2028.
- Bulls point to margin expansion as a key part of their thesis, but the latest annual net margin of 16.4% sits well below the 26.2% margin they expect in the bullish narrative.
- They also anchor on a path to US$6.7b of earnings by around 2028, compared with the current trailing US$3.5b, so the current EPS profile shows progress but still a long distance to those targets.
Strong earnings growth and a 16.4% margin have bulls arguing this could be an early stage of a much bigger profitability story, while these results also show how much needs to go right for that script to play out. 🐂 Fiserv Bull Case
Revenue Growth At 1.4% Tests Bullish Ambitions
- Trailing twelve month revenue sits at US$21.2b, up from US$20.5b a year earlier, which lines up with the 1.4% annual revenue growth rate flagged in the data and contrasts with quarterly revenue that has stayed in a fairly tight band between US$5.1b and US$5.5b.
- Consensus narrative supporters often talk about global expansion of platforms like Clover and new partnerships as fuel for stronger growth. Yet the current 1.4% revenue growth rate and the guidance that revenue growth is expected to be slower than the broader US market show that, so far, those product and geographic moves are not reflected in a faster top line.
- Analysts in the balanced view model revenue rising about 5.4% a year over the next few years, which is a noticeable step up from the 1.4% rate recorded in the trailing data set.
- They also assume margins could move from about 16% today toward 24%, so the combination of modest current revenue growth and a 16.4% margin gives you a concrete baseline to compare against those future expectations.
Low 9.7x P/E Versus Debt Load
- Fiserv trades on a trailing P/E of 9.7x at a share price of US$62.59, which is below the US Diversified Financial industry average of 15.2x and well below the 47.4x peer average, while a DCF fair value of about US$161.46 in the data sits far above that price.
- Bears focus on the high debt level and modest 1.4% revenue growth to argue that even a low 9.7x P/E should be viewed in the context of balance sheet risk and slower expected growth, and these results give them some support as leverage is flagged as a risk and revenue growth is described as likely to trail the broader US market.
- The gap between the current price of US$62.59 and the DCF fair value of roughly US$161.46 suggests valuation upside in that model, yet the flagged high debt load means any pressure on earnings or cash flows could matter more than it would for a low leverage company.
- Bears also point to the reliance on acquisitions and slower organic growth, and the modest revenue increase from US$20.5b to US$21.2b over the year fits with their concern that earnings growth may not stay ahead of those balance sheet and growth headwinds.
If you are weighing that low 9.7x P/E against the company’s debt and slower revenue growth, the cautious narrative around balance sheet risk and
Next Steps
To see how these results tie into long-term growth, risks, and valuation, check out the full range of community narratives for Fiserv on Simply Wall St. Add the company to your watchlist or portfolio so you'll be alerted when the story evolves.
See the numbers differently? Take a fresh look at the figures, trust your own judgment, and shape that into a clear narrative in just a few minutes. Do it your way
A great starting point for your Fiserv research is our analysis highlighting 3 key rewards and 1 important warning sign that could impact your investment decision.
See What Else Is Out There
For all the healthy margins, Fiserv’s modest 1.4% revenue growth and reliance on debt stand out as pressure points against the more optimistic narratives.
If that mix of slower growth and leverage makes you uneasy, you might want to look at solid balance sheet and fundamentals stocks screener (45 results) that prioritize financial strength and reduce the risk that debt becomes the main story.
This article by Simply Wall St is general in nature. We provide commentary based on historical data and analyst forecasts only using an unbiased methodology and our articles are not intended to be financial advice. It does not constitute a recommendation to buy or sell any stock, and does not take account of your objectives, or your financial situation. We aim to bring you long-term focused analysis driven by fundamental data. Note that our analysis may not factor in the latest price-sensitive company announcements or qualitative material. Simply Wall St has no position in any stocks mentioned.