Flagstar Bank (FLG) Valuation Check After Recent Share Price Rebound
Flagstar Financial FLG | 13.48 | +0.82% |
- If you are wondering whether Flagstar Bank National Association is priced attractively right now, this article explains what the current share price might be implying about its value.
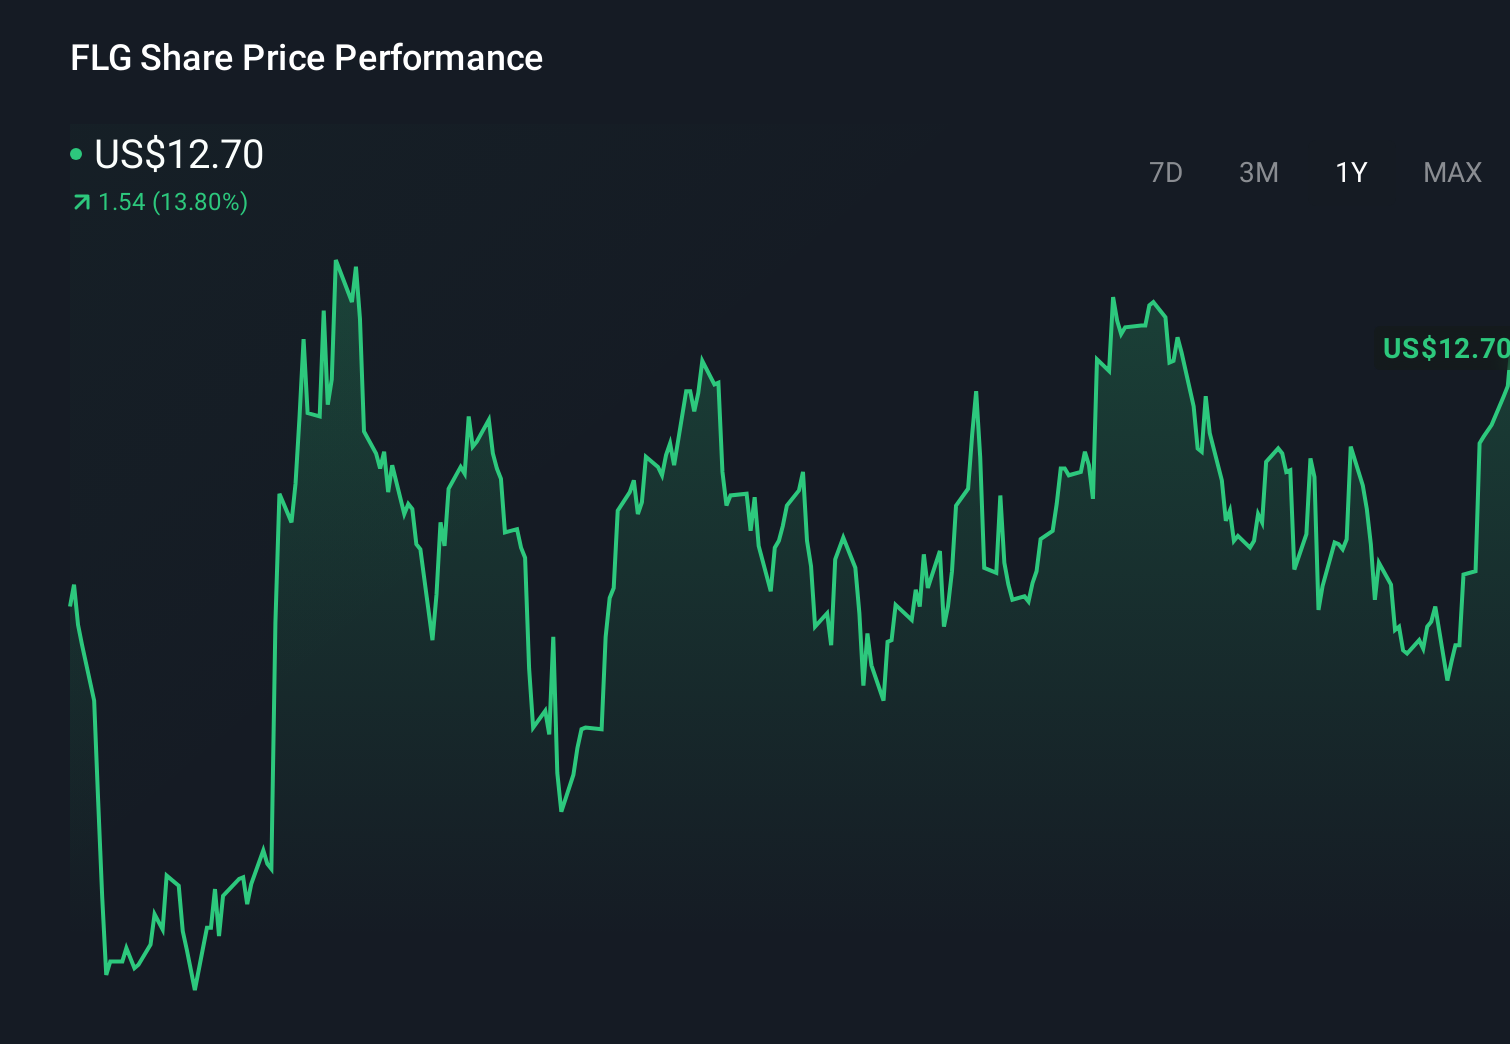
- The stock last closed at US$14.27, with returns of 7.9% over the past week, 9.4% over the past month, 13.7% year to date and 16.3% over the past year, while the 3 year and 5 year returns show declines of 46.7%.
- Recent trading activity appears to reflect investors reassessing the bank after a period of weaker multi year returns, which can change how the market prices risk. Even without a single headline event driving the move, the combination of shorter term gains and longer term declines gives important context for how the stock might be valued today.
- Simply Wall St currently gives Flagstar Bank National Association a valuation score of 2 out of 6, meaning it screens as undervalued on 2 of the 6 checks. Next, we will walk through what different valuation methods say about that number and outline a broader way to think about valuation by the end of the article.
Flagstar Bank National Association scores just 2/6 on our valuation checks. See what other red flags we found in the full valuation breakdown.
Approach 1: Flagstar Bank National Association Excess Returns Analysis
The Excess Returns model looks at how much profit a bank is expected to earn on its equity compared with the return that shareholders require. If the bank can consistently earn more than that required return, those “excess” profits add value on top of today’s book value.
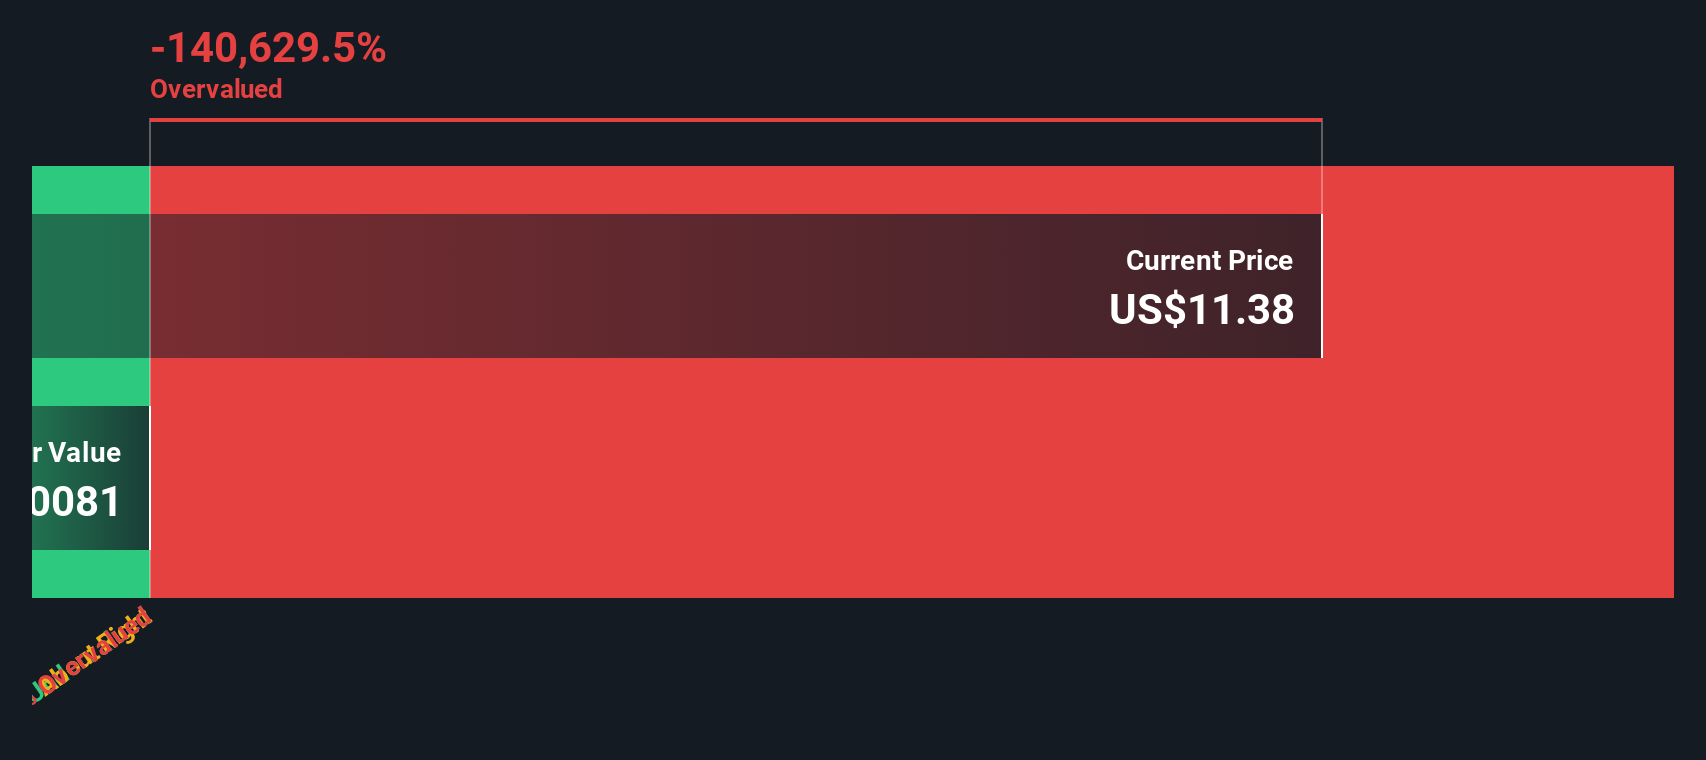
For Flagstar Bank National Association, the model uses a Book Value of US$18.37 per share and a Stable EPS estimate of US$1.39 per share, based on weighted future Return on Equity estimates from 8 analysts. The Average Return on Equity is 6.99%, while the Cost of Equity is US$1.82 per share. That leads to an Excess Return of US$0.43 per share in the model, together with a Stable Book Value of US$19.92 per share, also sourced from weighted future Book Value estimates from 8 analysts.
Combining these inputs, the Excess Returns model arrives at an intrinsic value of about US$12.41 per share. Compared with the recent share price of US$14.27, this suggests the stock is roughly 15.0% overvalued on this approach.
Result: OVERVALUED
Our Excess Returns analysis suggests Flagstar Bank National Association may be overvalued by 15.0%. Discover 52 high quality undervalued stocks or create your own screener to find better value opportunities.
Approach 2: Flagstar Bank National Association Price vs Book
For banks, the price to book ratio is often a useful yardstick because the balance sheet is central to how they operate and book value gives a reference point for the net assets supporting the business. You can think of it as what you are paying for each dollar of equity on the balance sheet.
In general, higher expected growth and lower perceived risk can justify a higher “normal” P/B ratio, while lower growth and higher risk can mean a lower multiple is more appropriate. The question is what looks normal for Flagstar Bank National Association today, given what we know.
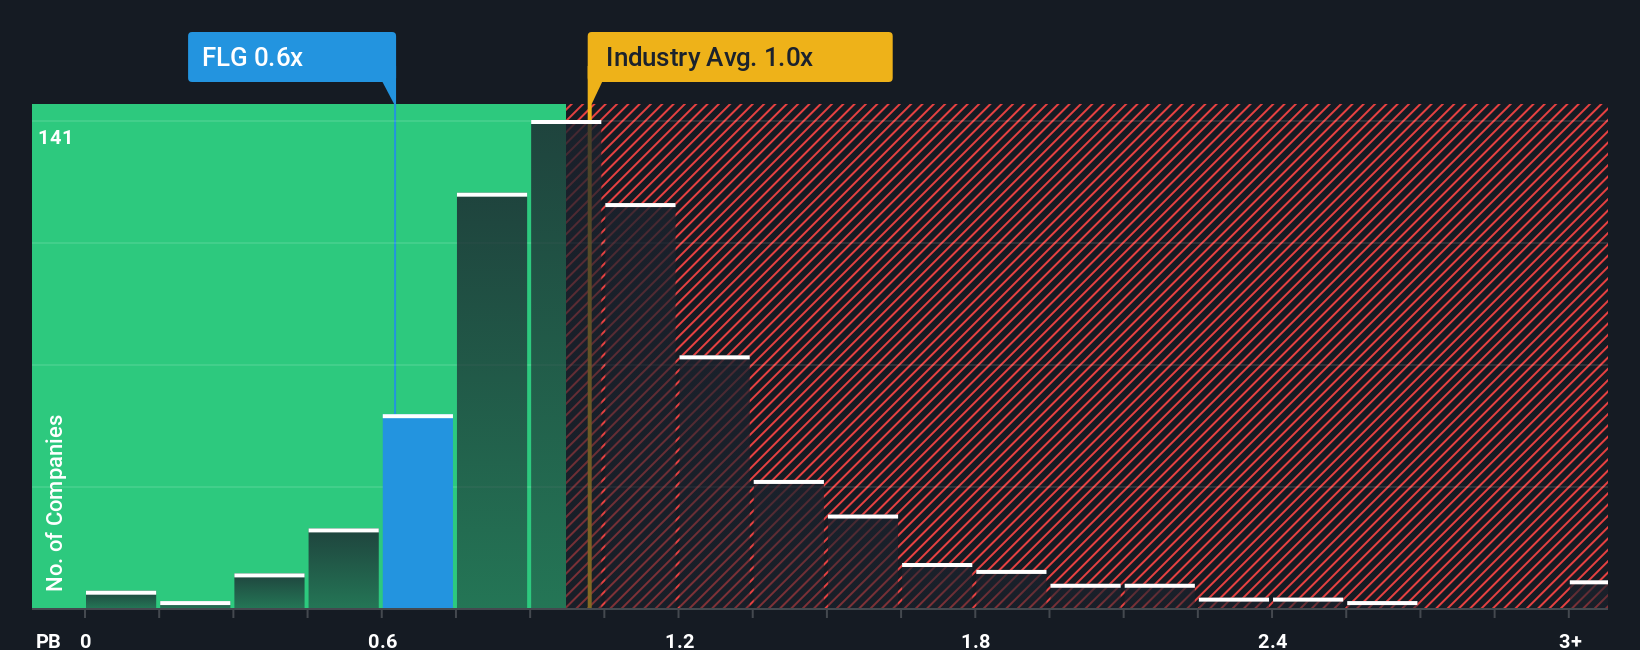
Flagstar Bank National Association currently trades on a P/B of 0.78x, compared with the Banks industry average of about 1.14x and a peer average of 1.39x. Simply Wall St’s Fair Ratio is its own estimate of what a reasonable P/B might be after accounting for factors such as earnings profile, profit margins, industry, market value and risk. Because this Fair Ratio is tailored to the company’s characteristics, it can be more informative than a simple comparison with sector or peer averages.
With the Fair Ratio not available here, it is not possible to say whether 0.78x screens as overvalued, undervalued or about right on this metric alone.
Result: ABOUT RIGHT
P/B ratios tell one story, but what if the real opportunity lies elsewhere? Start investing in legacies, not executives. Discover our 22 top founder-led companies.
Upgrade Your Decision Making: Choose your Flagstar Bank National Association Narrative
Earlier we mentioned that there is an even better way to understand valuation, so let us introduce you to Narratives, which are simply your story about Flagstar Bank National Association, captured as your view of its future revenue, earnings and margins, linked directly to a forecast and your own fair value estimate on Simply Wall St’s Community page, where millions of investors share their views.
Instead of only looking at ratios, a Narrative lets you say why you think the business might perform a certain way. You can then see how that story translates into numbers and what that implies for fair value today.
You can then compare your fair value to the current share price to help decide whether the stock looks attractive, expensive or somewhere in between for your goals. Your Narrative will automatically refresh when new information such as earnings releases or news is added to the platform.
For example, one Flagstar Bank National Association Narrative might assume a relatively low fair value with modest revenue growth and cautious profit margins. Another might set a higher fair value with stronger revenue growth and more optimistic margins. This shows how two investors can reasonably disagree yet still use the same structured framework.
Do you think there's more to the story for Flagstar Bank National Association? Head over to our Community to see what others are saying!
This article by Simply Wall St is general in nature. We provide commentary based on historical data and analyst forecasts only using an unbiased methodology and our articles are not intended to be financial advice. It does not constitute a recommendation to buy or sell any stock, and does not take account of your objectives, or your financial situation. We aim to bring you long-term focused analysis driven by fundamental data. Note that our analysis may not factor in the latest price-sensitive company announcements or qualitative material. Simply Wall St has no position in any stocks mentioned.