Fortinet (FTNT) Margin Decline Challenges Bullish Earnings Growth Narratives
Fortinet, Inc. FTNT | 79.64 80.40 | +1.19% +0.95% Pre |
Fortinet (FTNT) has wrapped up FY 2025 with fourth quarter revenue of about US$1.9b and basic EPS of US$0.68, alongside net income excluding extra items of US$506m. This gives investors a clear read on its recent trading momentum. The company has seen quarterly revenue move from US$1.66b in Q4 2024 to US$1.91b in Q4 2025, while basic EPS shifted from US$0.69 to US$0.68 over the same period. This sets the scene for a year where margins and profit quality remain in sharp focus.
See our full analysis for Fortinet.With the headline numbers on the table, the next step is to see how this earnings profile lines up with the prevailing market narratives around Fortinet's growth, profitability, and long term trajectory.
TTM profit growth slows to 6.2%
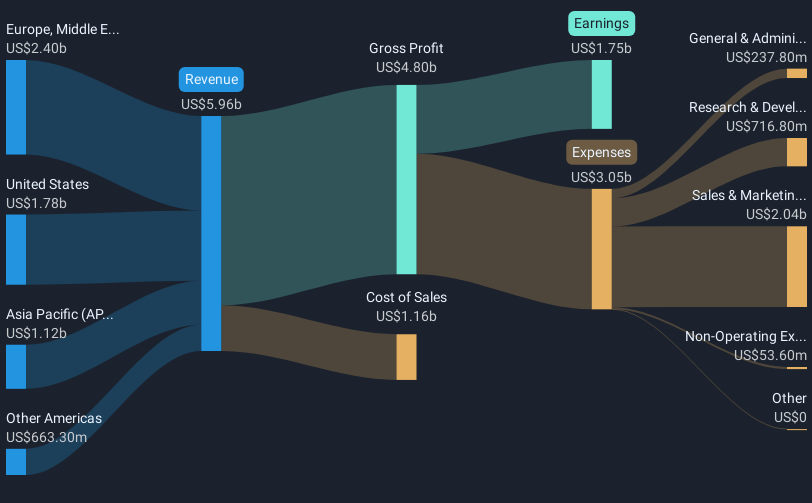
- Over the last 12 months, profit growth is cited at 6.2%, compared with a five year earnings growth rate of 29.5% per year. The recent pace is well below the longer trend even though trailing 12 month net income excluding extra items is still US$1.9b on US$6.8b of revenue.
- What stands out for bullish investors is that this slower 6.2% one year earnings growth sits alongside earnings that are described as high quality. This creates a tension between:
- Multi year strength, with that 29.5% annual earnings growth over five years pointing to a long track record of profit expansion.
- The recent moderation, where the 6.2% trailing growth and a trailing net profit margin of 27.3% suggest the latest year has been less strong than that history.
Margins ease from 29.3% to 27.3%
- The data flags a trailing net profit margin of 27.3%, compared with 29.3% a year earlier, alongside trailing 12 month revenue of US$6.8b and net income excluding extra items of US$1.9b.
- Critics point to the margin slip as a bearish sign, and that concern lines up with other figures here, because:
- One year earnings growth of 6.2% is lower than the 29.5% per year pace over five years, so the margin dip comes at the same time as slower profit growth.
- Analyst forecasts in the dataset of about 9.95% annual earnings and revenue growth are also below the cited broader US market growth rates, which bears may read as a slower growth profile combined with slightly lower margins.
P/E of 33.2x and DCF gap
- Fortinet is trading on a trailing P/E of 33.2x at a share price of US$82.76, compared with a DCF fair value in the data of US$109.45 and a US Software industry average P/E of 26.9x, while the peer group average P/E is 50.9x.
- Supporters of the bullish view often highlight this valuation mix, and the numbers here give them specific talking points as well as some pushback, because:
- The stock price is about 24.4% below the cited DCF fair value, which they may see as valuation headroom if the roughly 9.95% earnings growth forecasts are reached.
- At the same time, the 33.2x P/E stands above the wider US Software industry average and follows a year where earnings growth was 6.2% and margins eased, which can limit how strong that bullish argument feels.
Bulls and skeptics are using the same set of numbers here, so if you want to see how others are joining the dots on growth, margins, and valuation, it is worth reading the broader discussion in Curious how numbers become stories that shape markets? Explore Community Narratives
Next Steps
Don't just look at this quarter; the real story is in the long-term trend. We've done an in-depth analysis on Fortinet's growth and its valuation to see if today's price is a bargain. Add the company to your watchlist or portfolio now so you don't miss the next big move.
See What Else Is Out There
Fortinet's slower 6.2% earnings growth, easing net margin, and 33.2x P/E together point to a less compelling growth profile at the current price.
If that mix of softer growth and a full looking multiple gives you pause, check out 53 high quality undervalued stocks that pair stronger fundamentals with more attractive pricing right now.
This article by Simply Wall St is general in nature. We provide commentary based on historical data and analyst forecasts only using an unbiased methodology and our articles are not intended to be financial advice. It does not constitute a recommendation to buy or sell any stock, and does not take account of your objectives, or your financial situation. We aim to bring you long-term focused analysis driven by fundamental data. Note that our analysis may not factor in the latest price-sensitive company announcements or qualitative material. Simply Wall St has no position in any stocks mentioned.