

Freedom Holding (FRHC) After Turkish Bank Approval Has A Pricey Valuation Question
Freedom Holding Corp. FRHC | 0.00 |
Freedom Holding (FRHC) is drawing attention after Turkish regulators approved its acquisition of a 99.32% stake in Turkish Bank. This is a material move for the company’s regional banking and digital services ambitions.
Freedom Holding’s latest Turkish Bank approval comes after a sharp 7 day share price return of 25.92% and a year to date share price return of 30.58%, while the 3 year total shareholder return of 106.64% points to stronger long run performance and suggests recent momentum has been building from an already solid base.
If you are looking beyond Freedom Holding and want more ideas riding financial and technology trends, this could be a good moment to hunt through 20 top founder-led companies
So with Freedom Holding now trading near its recent highs, a P/E of 62.6x and no apparent discount to some intrinsic estimates, should you view the recent gains as a fresh buying opportunity, or as a sign that markets are already pricing in future growth?
Price-to-Earnings of 64.8x: Is It Justified for Freedom Holding?
Based on current data, Freedom Holding trades on a P/E of 64.8x, compared with a peer average of 17x and a US Capital Markets industry average of 39.7x. This points to a materially richer valuation at the last close of $162.22.
The P/E ratio compares the share price with earnings per share. A higher multiple usually means investors are willing to pay more today for each unit of current earnings. For a diversified group like Freedom Holding that spans brokerage, banking, insurance and other services, a high P/E can reflect expectations for stronger profitability or durable earnings quality. However, the company’s value score of 0 and high level of non cash earnings suggest the market is paying up despite some quality questions in the reported results.
Compared with peers on 17x and an industry average of 39.7x, Freedom Holding’s 64.8x multiple stands out as expensive. This implies the market is assigning a premium to its growth profile and business mix rather than valuing it in line with sector norms.
Result: Price-to-Earnings of 64.8x (OVERVALUED)
However, Freedom Holding’s premium P/E and reliance on non cash earnings could face pressure if regulatory scrutiny rises or integration risks from acquisitions begin to have an impact.
Another View: What Our DCF Model Signals For Freedom Holding
While the P/E discussion suggests Freedom Holding is richly priced, our DCF model points to an even starker gap. With the stock at $162.22 versus an estimated future cash flow value of $60.28, the shares screen as overvalued on this second lens as well. This raises the question of how much optimism is already in the price.
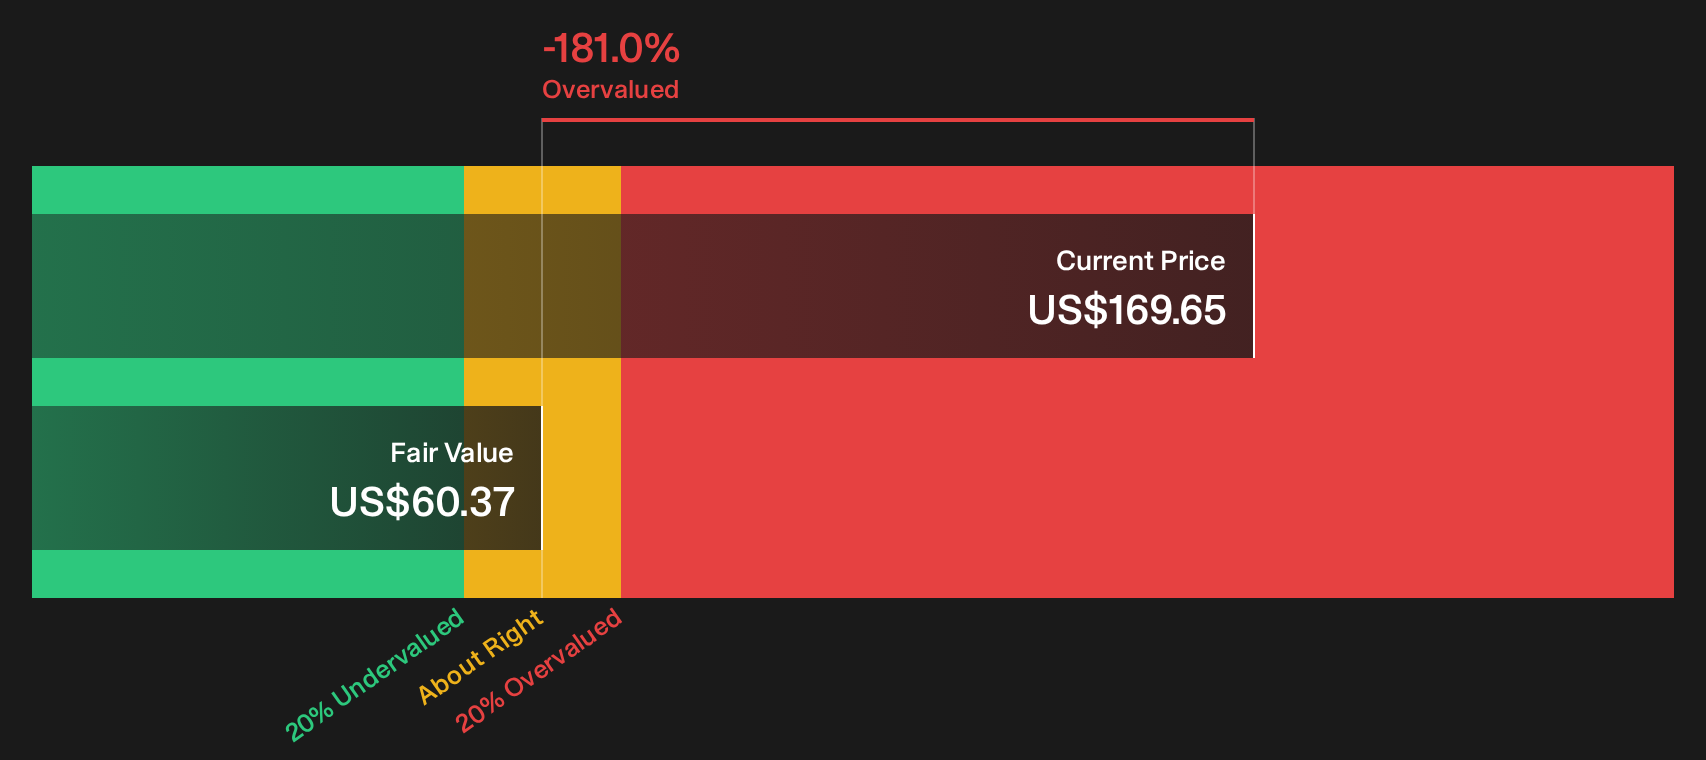
Simply Wall St performs a discounted cash flow (DCF) on every stock in the world every day (check out Freedom Holding for example). We show the entire calculation in full. You can track the result in your watchlist or portfolio and be alerted when this changes, or use our stock screener to discover 44 high quality undervalued stocks. If you save a screener we even alert you when new companies match - so you never miss a potential opportunity.
Next Steps
Given the mixed signals around Freedom Holding, the next step is to move fast and test the numbers against your own expectations using the 1 key reward and 3 important warning signs.
Looking For More Investment Ideas Beyond Freedom Holding?
Do not stop with Freedom Holding. Broaden your watchlist with fresh ideas that fit your style so you are not relying on a single crowded trade.
- Target dependable income by focusing on companies with robust payouts and coverage through the 7 dividend fortresses.
- Zero in on quality at a sensible price by scanning financially solid companies trading below intrinsic estimates using the 44 high quality undervalued stocks.
- Prioritize sleep at night potential by concentrating on businesses with steadier risk profiles via the 74 resilient stocks with low risk scores.
This article by Simply Wall St is general in nature. We provide commentary based on historical data and analyst forecasts only using an unbiased methodology and our articles are not intended to be financial advice. It does not constitute a recommendation to buy or sell any stock, and does not take account of your objectives, or your financial situation. We aim to bring you long-term focused analysis driven by fundamental data. Note that our analysis may not factor in the latest price-sensitive company announcements or qualitative material. Simply Wall St has no position in any stocks mentioned.