Gap (GPS) Valuation Check After Q3 Beat And Ongoing Analyst Upgrades
Gap, Inc. GAP | 24.61 | -0.61% |
Gap (GAP) is back in focus after reporting Q3 revenue growth of 3% year on year, beating analyst expectations on sales, EBITDA and gross margin, and posting a seventh consecutive quarter of positive comparable sales.
The recent Q3 beat and a series of upbeat analyst updates have coincided with a 22.67% 90 day share price return and a 104.70% three year total shareholder return, signalling firm momentum from short term traders and longer term holders alike.
If Gap’s recent move has your attention, it could be a good moment to widen your watchlist and check out fast growing stocks with high insider ownership.
With shares up nearly 23% over 90 days and analysts lifting their targets, the key question now is whether Gap’s recent success is already reflected in the US$27.98 share price or if the market is still underestimating future growth.
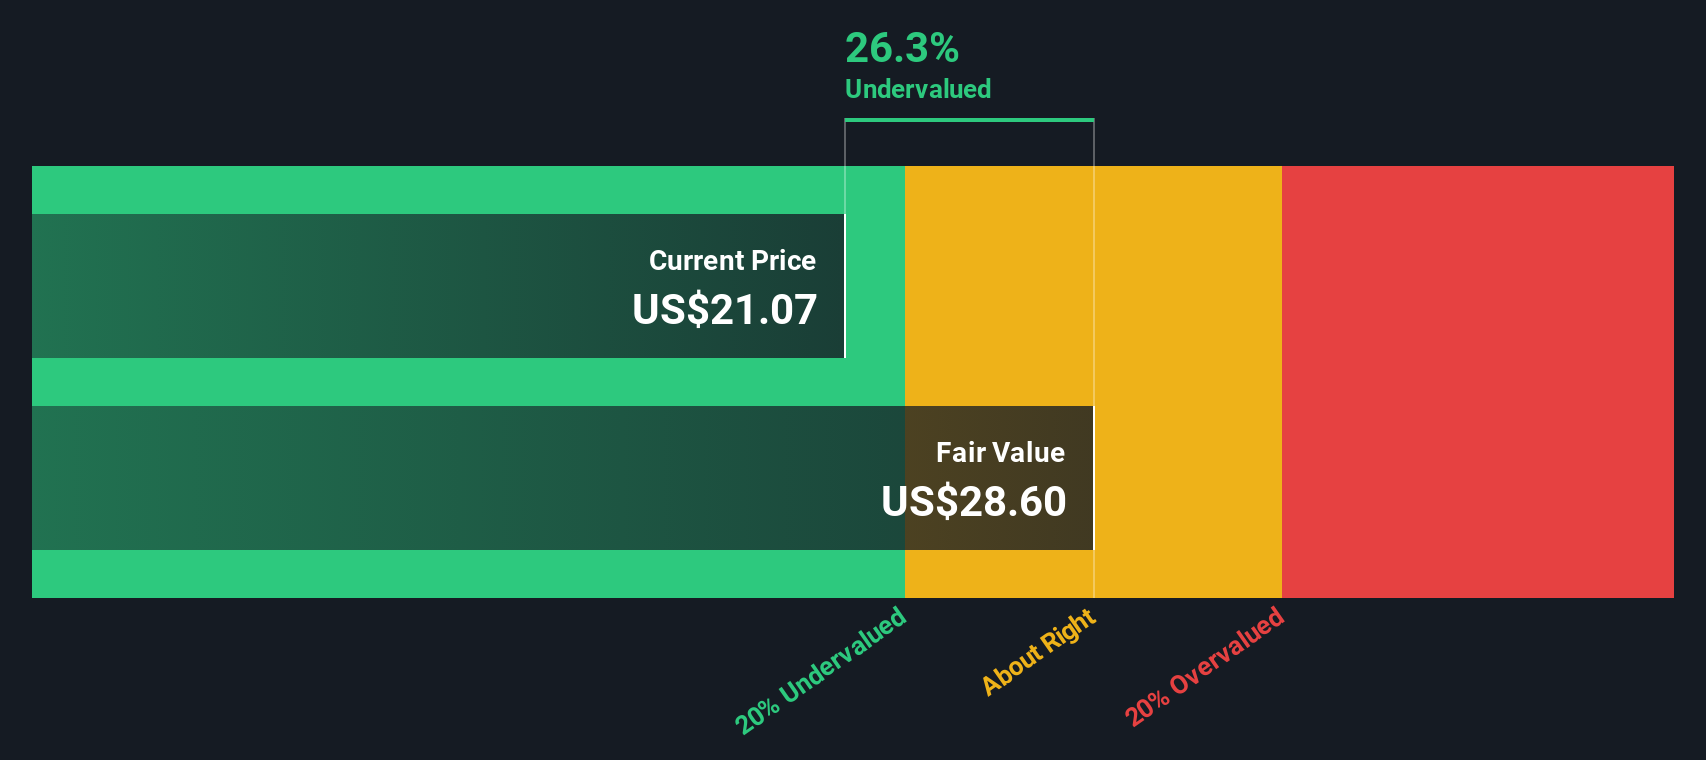
Most Popular Narrative: 4.1% Undervalued
Gap’s most followed narrative pegs fair value at about $29.18, slightly above the last close at $27.98, which frames a modest valuation gap worth understanding.
Strong value positioning, digital investments, and brand reinvigoration are driving customer engagement, stable demand, and long term margin expansion. Operational discipline, portfolio optimization, and sustainable sourcing initiatives position Gap for future growth and enhanced competitive advantage.
Curious what sits behind that confidence in margins and earnings power? The narrative focuses on measured revenue growth, steadier profitability, and a higher future earnings multiple. The full set of assumptions combines those pieces into one clear fair value story.
Result: Fair Value of $29.18 (UNDERVALUED)
However, the narrative could be tested if Athleta’s reset phase drags on earnings longer than expected, or if tariff and trade pressures keep squeezing operating margins.
Another View: Cash Flows Paint A Tighter Picture
While the popular narrative sees Gap as about 4.1% undervalued with a fair value near $29.18, our DCF model is more cautious. It puts future cash flow value at $27.69 versus the $27.98 share price, which points to a slight premium instead. Which story do you think fits best?
Simply Wall St performs a discounted cash flow (DCF) on every stock in the world every day (check out Gap for example). We show the entire calculation in full. You can track the result in your watchlist or portfolio and be alerted when this changes, or use our stock screener to discover 875 undervalued stocks based on their cash flows. If you save a screener we even alert you when new companies match - so you never miss a potential opportunity.
Build Your Own Gap Narrative
If you look at the numbers and reach a different conclusion, or simply prefer to back your own judgement, you can build a custom Gap story in just a few minutes. To begin, start with Do it your way.
A great starting point for your Gap research is our analysis highlighting 4 key rewards and 2 important warning signs that could impact your investment decision.
Looking for more investment ideas?
If Gap has sharpened your focus, do not stop here. Broaden your opportunity set now with fresh stock ideas that could fit your next move.
- Spot early stage growth potential by checking out these 3527 penny stocks with strong financials that already show stronger financial foundations than many peers.
- Explore the AI trend by reviewing these 24 AI penny stocks that combine emerging technology use cases with listed market access.
- Search for potential value by scanning these 875 undervalued stocks based on cash flows that may trade below what their underlying cash flows suggest.
This article by Simply Wall St is general in nature. We provide commentary based on historical data and analyst forecasts only using an unbiased methodology and our articles are not intended to be financial advice. It does not constitute a recommendation to buy or sell any stock, and does not take account of your objectives, or your financial situation. We aim to bring you long-term focused analysis driven by fundamental data. Note that our analysis may not factor in the latest price-sensitive company announcements or qualitative material. Simply Wall St has no position in any stocks mentioned.