

General Motors (GM) Completes Buyback, Is The Discount To Fair Value Too Wide?
General Motors Company GM | 0.00 |
General Motors (GM) stock is in focus after the company completed a large share repurchase program and reaffirmed its quarterly dividend, moves that directly affect share count and ongoing cash returns to investors.
The recent buyback completion, dividend affirmation and upgraded 2026 guidance have coincided with a 1-year total shareholder return of 56.0%, while the 3-year total shareholder return of 121.19% points to strong longer term momentum from General Motors.
If this kind of move has you looking beyond autos, it could be a good time to widen your search with a screener focused on 36 power grid technology and infrastructure stocks
After a 56.0% 1 year total return, General Motors now trades at roughly a 19.6% discount to the average analyst target and an indicated 37.5% discount to estimated intrinsic value. Are investors rightly cautious or excessively skeptical?
Most Popular Narrative: 22.8% Overvalued
According to the most followed narrative on General Motors, the fair value sits at $66.90 per share, which is below the recent $82.13 close and implies a richer valuation than that narrative supports.
GM’s valuation remains modest relative to earnings and cash flow, reflecting skepticism about the auto industry’s ability to generate durable returns during the EV transition. The market discounts execution risk, margin compression, and long-term uncertainty.
Curious what justifies that fair value gap for General Motors? The narrative leans heavily on a specific growth path, margin profile, and future earnings multiple that are anything but conservative.
Result: Fair Value of $66.90 (OVERVALUED)
However, General Motors could still surprise this narrative if EV economics improve faster than expected, or if software and subscription revenue scales meaningfully faster than modeled.
Another View: General Motors Through a Cash Flow Lens
Where the most popular General Motors narrative sees the stock as 22.8% overvalued at $82.13 versus a $66.90 fair value, our DCF model points the other way, with a future cash flow value of $131.31. These are two grounded methods that arrive at very different answers, so which risk are you more comfortable taking?
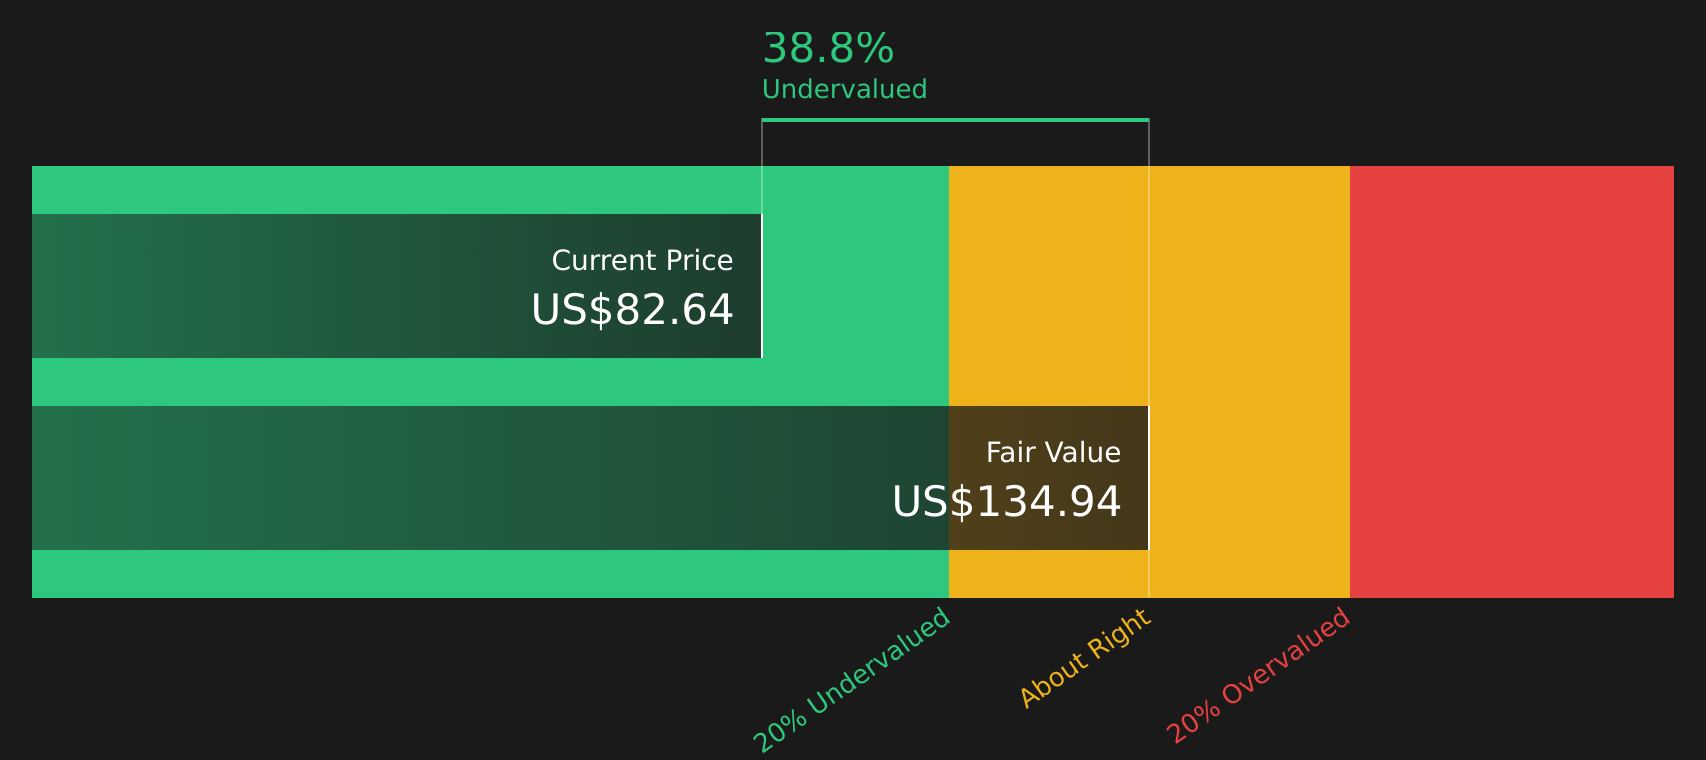
Simply Wall St performs a discounted cash flow (DCF) on every stock in the world every day (check out General Motors for example). We show the entire calculation in full. You can track the result in your watchlist or portfolio and be alerted when this changes, or use our stock screener to discover 47 high quality undervalued stocks. If you save a screener we even alert you when new companies match - so you never miss a potential opportunity.
Next Steps
Seeing both optimism and concern around General Motors in the data, it makes sense to review the details now and shape your own take with the 2 key rewards and 4 important warning signs
Looking for more investment ideas beyond General Motors?
If General Motors has sharpened your focus on opportunities, do not stop here. Use targeted screeners to uncover more stocks that could fit your strategy.
- Target reliable cash generators by scanning companies with strong fundamentals using the solid balance sheet and fundamentals stocks screener (49 results).
- Hunt for potential bargains by reviewing companies that appear attractively priced through the 47 high quality undervalued stocks.
- Seek out underfollowed opportunities before others catch on by checking the screener containing 20 high quality undiscovered gems.
This article by Simply Wall St is general in nature. We provide commentary based on historical data and analyst forecasts only using an unbiased methodology and our articles are not intended to be financial advice. It does not constitute a recommendation to buy or sell any stock, and does not take account of your objectives, or your financial situation. We aim to bring you long-term focused analysis driven by fundamental data. Note that our analysis may not factor in the latest price-sensitive company announcements or qualitative material. Simply Wall St has no position in any stocks mentioned.