General Motors (GM) Stock After 62% One-Year Rally Is There Still Value?
General Motors Company GM | 0.00 |
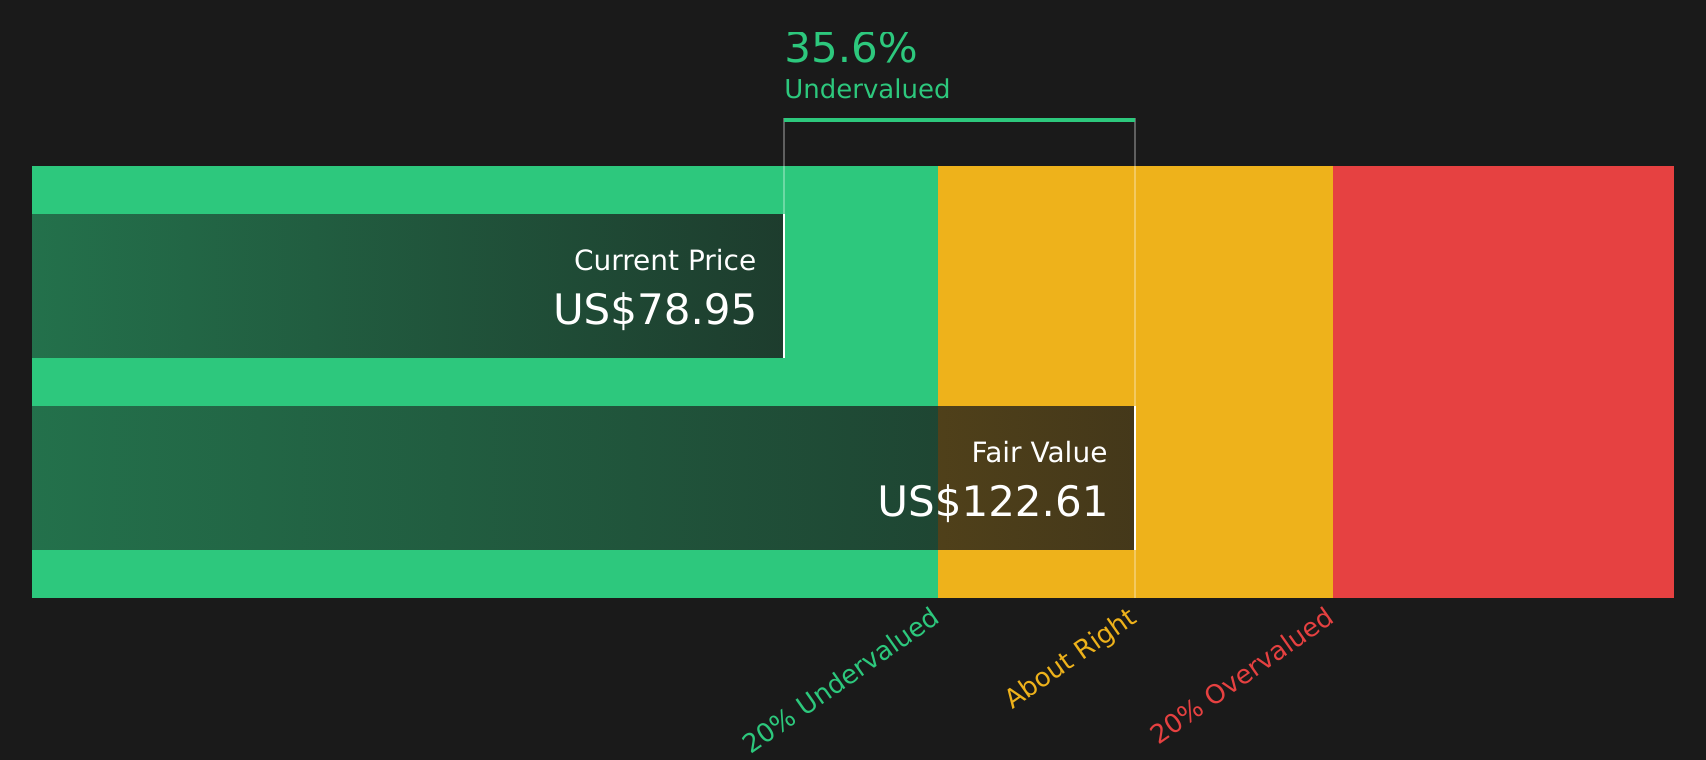
- If you are wondering whether General Motors at around US$78.95 is still offering value after a strong run, this article breaks down what the current price might be implying.
- The stock has pulled back about 4.3% over the past week, is roughly flat over the last month, slightly down 2.5% year to date, yet up 62.6% over the past year and 117.2% over three years, with a 39.7% return over five years.
- Recent attention on General Motors has centered on how investors are reassessing large established automakers as they balance traditional vehicles with newer technologies and business lines. This context helps explain why the stock can show short term setbacks while still reflecting stronger multi year returns.
- General Motors currently scores 3 out of 6 on Simply Wall St’s valuation checks. You can see the details at its valuation score. The rest of this article will compare different valuation approaches before finishing with a more holistic way to think about what the stock might be worth.
Approach 1: General Motors Discounted Cash Flow (DCF) Analysis
A Discounted Cash Flow, or DCF, model estimates what General Motors stock could be worth by projecting future cash flows and discounting them back to today’s value. It is essentially asking what those future dollars are worth in today’s terms.
General Motors last reported Free Cash Flow of about US$13.6b. The DCF model used here is a 2 Stage Free Cash Flow to Equity approach, which starts with analyst projections and then extends them using Simply Wall St estimates. For example, projected Free Cash Flow for 2028 is US$11.7b, and the model includes a full set of yearly projections out to 2035 in US$.
Bringing all those future cash flows back to today, the model arrives at an estimated intrinsic value of US$122.61 per share. Compared with the current share price of about US$78.95, this implies the stock is 35.6% undervalued according to this DCF model.
Result: UNDERVALUED
Our Discounted Cash Flow (DCF) analysis suggests General Motors is undervalued by 35.6%. Track this in your watchlist or portfolio, or discover 44 more high quality undervalued stocks.
Approach 2: General Motors Price vs Earnings
For a profitable company like General Motors, the P/E ratio is a useful way to relate what you pay for the stock to the earnings it currently generates. Investors usually expect higher growth or lower risk to justify a higher P/E, and lower growth or higher risk to justify a lower P/E.
General Motors currently trades on a P/E of 29.26x. That is above the Auto industry average P/E of 14.39x and also above the peer average of 27.31x. On the surface, this suggests you are paying a higher price for each dollar of General Motors earnings than for the typical company in its industry or peer group.
Simply Wall St’s Fair Ratio for General Motors is 31.14x. This is a proprietary estimate of what the P/E might be expected to be, given factors such as earnings growth, profit margins, industry, market cap and identified risks. Because it adjusts for these company specific features, the Fair Ratio can be more informative than a simple comparison with industry or peer averages. With the current P/E of 29.26x sitting below the Fair Ratio of 31.14x, General Motors stock screens as undervalued on this metric.
Result: UNDERVALUED

P/E ratios tell one story, but what if the real opportunity lies elsewhere? Start investing in legacies, not executives. Discover our 20 top founder-led companies.
Upgrade Your Decision Making: Choose your General Motors Narrative
Earlier it was mentioned that there is an even better way to understand valuation, so on Simply Wall St’s Community page you can use Narratives, which let you attach a clear story about General Motors to the numbers by setting your own assumptions for future revenue, earnings and margins, linking that story to a Fair Value, comparing it with the current price to help you decide whether the stock looks expensive or cheap on your terms, and then seeing that Fair Value update automatically as new news or earnings arrive. For example, a cautious investor might align with a lower Fair Value like US$67.0 based on flatter revenue and a 6.9x future P/E, while a more optimistic investor might anchor on a higher Fair Value around US$120.0 tied to revenue growth, higher margins and a 7.6x future P/E.
For General Motors, we will make it really easy for you with previews of two leading General Motors Narratives:
Fair Value: US$120.00
Implied undervaluation vs current price: 34.1%
Revenue growth assumption: 2.6%
- Focuses on a richer mix of U.S. trucks, SUVs and crossovers and on flexible manufacturing and Ultium based EVs to support margins and cash flow.
- Highlights growing software and services like OnStar and Super Cruise, as well as aftermarket and mobility activities, as potential contributors to more recurring earnings.
- Flags risks around EV adoption, tariffs, competition, quality issues and reliance on high margin trucks that could challenge this more optimistic view.
Fair Value: US$66.90
Implied overvaluation vs current price: 18.0%
Revenue growth assumption: 1.0%
- Frames General Motors as balancing a still important internal combustion engine business with heavy investment in EVs that remain capital intensive and uneven in terms of returns.
- Emphasizes that EV economics, legal and regulatory exposure, and the slower than hoped development of autonomy all add to execution risk.
- Notes that while the balance sheet and cash flow provide flexibility, investors still face uncertainty around how the transition spending and competitive pressures will affect future profitability.
If you want to see how other investors are weighing these trade offs and setting their own assumptions for General Motors, you can use community Narratives to compare these views with your own and track how they evolve over time with new information.
Do you think there's more to the story for General Motors? Head over to our Community to see what others are saying!

This article by Simply Wall St is general in nature. We provide commentary based on historical data and analyst forecasts only using an unbiased methodology and our articles are not intended to be financial advice. It does not constitute a recommendation to buy or sell any stock, and does not take account of your objectives, or your financial situation. We aim to bring you long-term focused analysis driven by fundamental data. Note that our analysis may not factor in the latest price-sensitive company announcements or qualitative material. Simply Wall St has no position in any stocks mentioned.