Has Apollo Global Management (APO) Become An Opportunity After The Recent Share Price Pullback?
Apollo Global Management Inc APO | 107.04 | -2.91% |
- If you are wondering whether Apollo Global Management's share price still lines up with its fundamentals, you are not alone. Many investors are asking whether the recent moves have opened up value or signalled a shift in expectations.
- The stock recently closed at US$126.08, after a 6.3% decline over the last 7 days, a 17.4% decline over 30 days and a 14.0% decline year to date. However, its 3 year and 5 year returns of 94.1% and 179.7% show a very different picture over longer periods.
- These recent moves are occurring against the backdrop of ongoing attention on large alternative asset managers like Apollo Global Management. Investors are reassessing how higher for longer rates, funding conditions and deal activity affect fee streams and asset values. Broader sector news on capital flows into private markets, regulatory scrutiny and fundraising conditions continues to shape sentiment toward firms in this space and provides an important backdrop to the share price pullback.
- On Simply Wall St's 6 point valuation checklist, Apollo Global Management currently scores 4 out of 6. This suggests some areas screen as potentially undervalued while others do not. Next we will look at how different valuation approaches arrive at that result before finishing with a more holistic way to think about value.
Approach 1: Apollo Global Management Excess Returns Analysis
The Excess Returns model looks at how much profit a company is expected to earn over and above the return that equity investors typically require, then capitalizes those extra returns into an intrinsic value per share.
For Apollo Global Management, the model uses a Book Value of $37.46 per share and a Stable EPS of $11.23 per share, based on weighted future Return on Equity estimates from 5 analysts. The Average Return on Equity used is 18.92%, compared with a Cost of Equity of $4.38 per share. That gap feeds into an estimated Excess Return of $6.85 per share.
The analysis also assumes a Stable Book Value of $59.37 per share, sourced from weighted future Book Value estimates from 3 analysts. Combining these elements, the Excess Returns framework produces an intrinsic value estimate of about $232.06 per share.
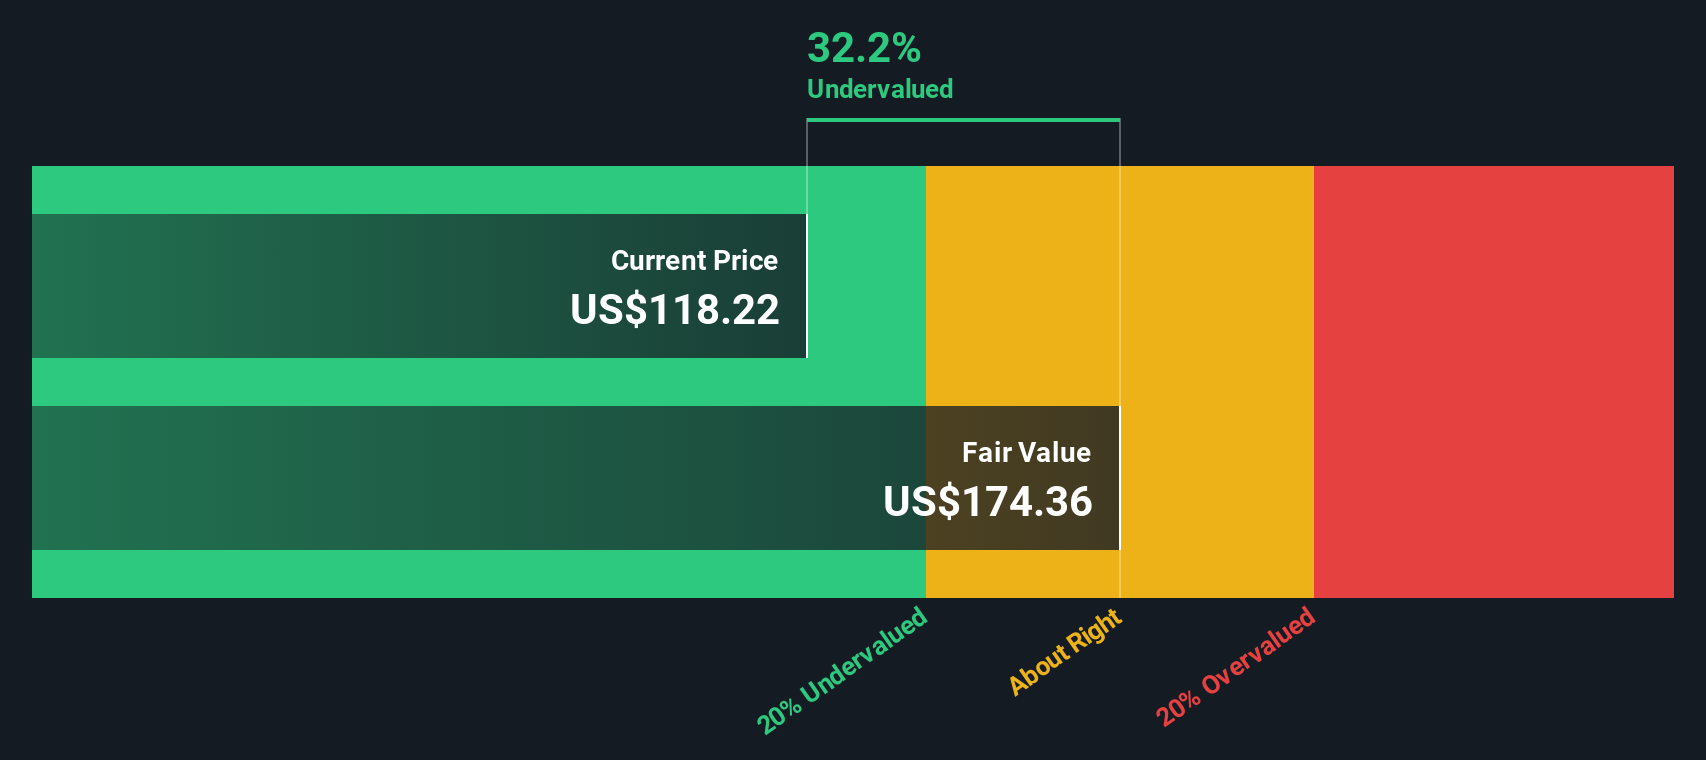
Set against the recent share price of US$126.08, the model implies the stock is about 45.7% undervalued. On this measure Apollo Global Management screens as cheap relative to the returns it is expected to earn on its equity base.
Result: UNDERVALUED
Our Excess Returns analysis suggests Apollo Global Management is undervalued by 45.7%. Track this in your watchlist or portfolio, or discover 55 more high quality undervalued stocks.
Approach 2: Apollo Global Management Price vs Earnings
For a profitable company like Apollo Global Management, the P/E ratio is a straightforward way to link what you pay per share to the earnings that support that price. It helps you see how much of a premium or discount the market is placing on each dollar of earnings.
What counts as a “normal” P/E comes down to expectations and risk. Higher expected earnings growth or lower perceived risk can justify a higher multiple, while slower growth or higher risk typically lines up with a lower one.
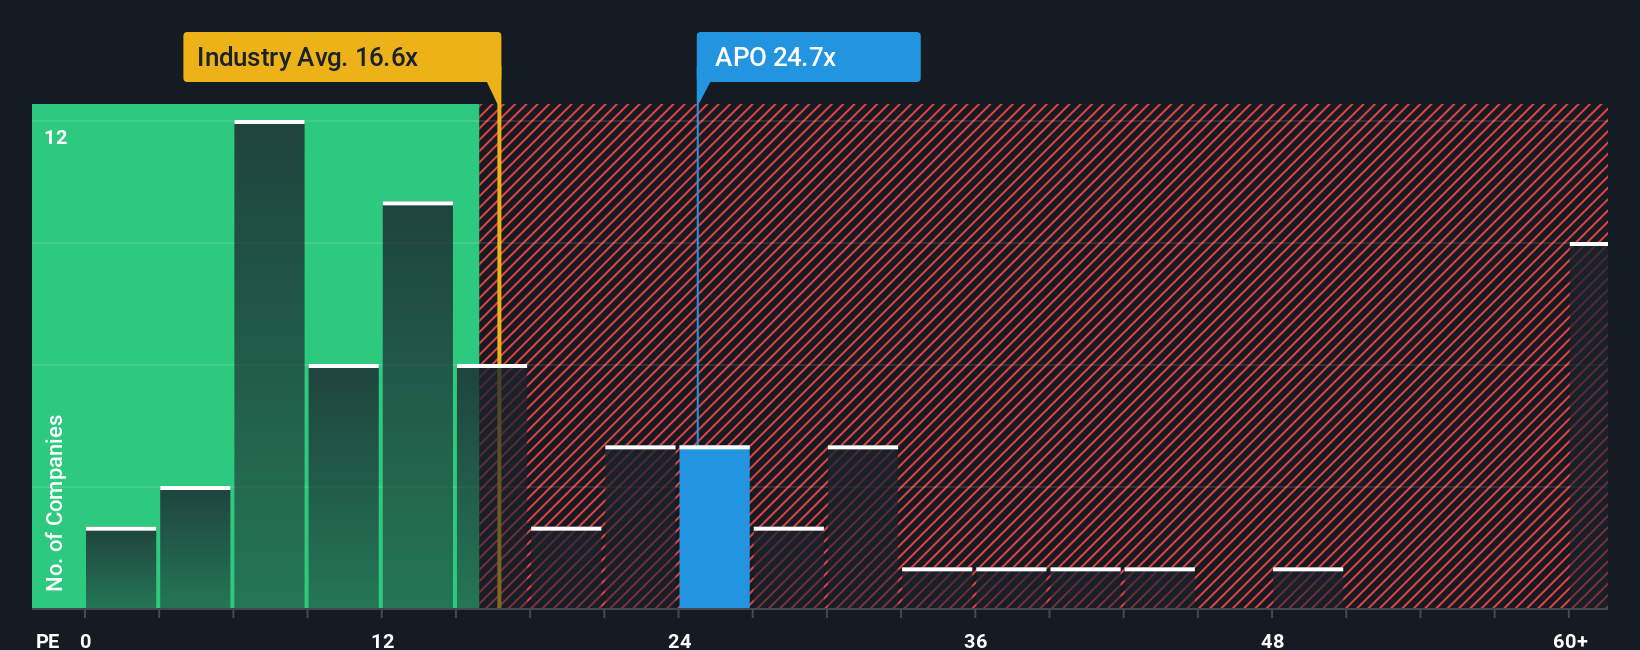
Apollo Global Management currently trades on a P/E of 18.01x. That stands above the Diversified Financial industry average of 15.24x and above the peer average of 12.14x, so on simple comparisons the stock carries a higher earnings multiple than many of its closest reference points.
Simply Wall St’s Fair Ratio for Apollo Global Management is 23.56x. This is a proprietary estimate of what the P/E could be, given factors like the company’s earnings growth profile, industry, profit margins, market cap and risk characteristics. Because it blends these elements into a single number, it can be more tailored than a basic check against industry or peer averages.
Putting that together, Apollo Global Management’s current P/E of 18.01x is below the Fair Ratio of 23.56x. This indicates that, on this earnings-based measure, the shares are assessed as undervalued.
Result: UNDERVALUED
P/E ratios tell one story, but what if the real opportunity lies elsewhere? Start investing in legacies, not executives. Discover our 22 top founder-led companies.
Upgrade Your Decision Making: Choose your Apollo Global Management Narrative
Earlier we mentioned that there is an even better way to understand valuation, so let us introduce you to Narratives. These are simply your story about Apollo Global Management paired with your own assumptions for future revenue, earnings, margins and a fair value estimate.
A Narrative ties three pieces together: what you think is happening with the business, how that translates into a financial forecast, and what price per share you believe is fair based on those numbers.
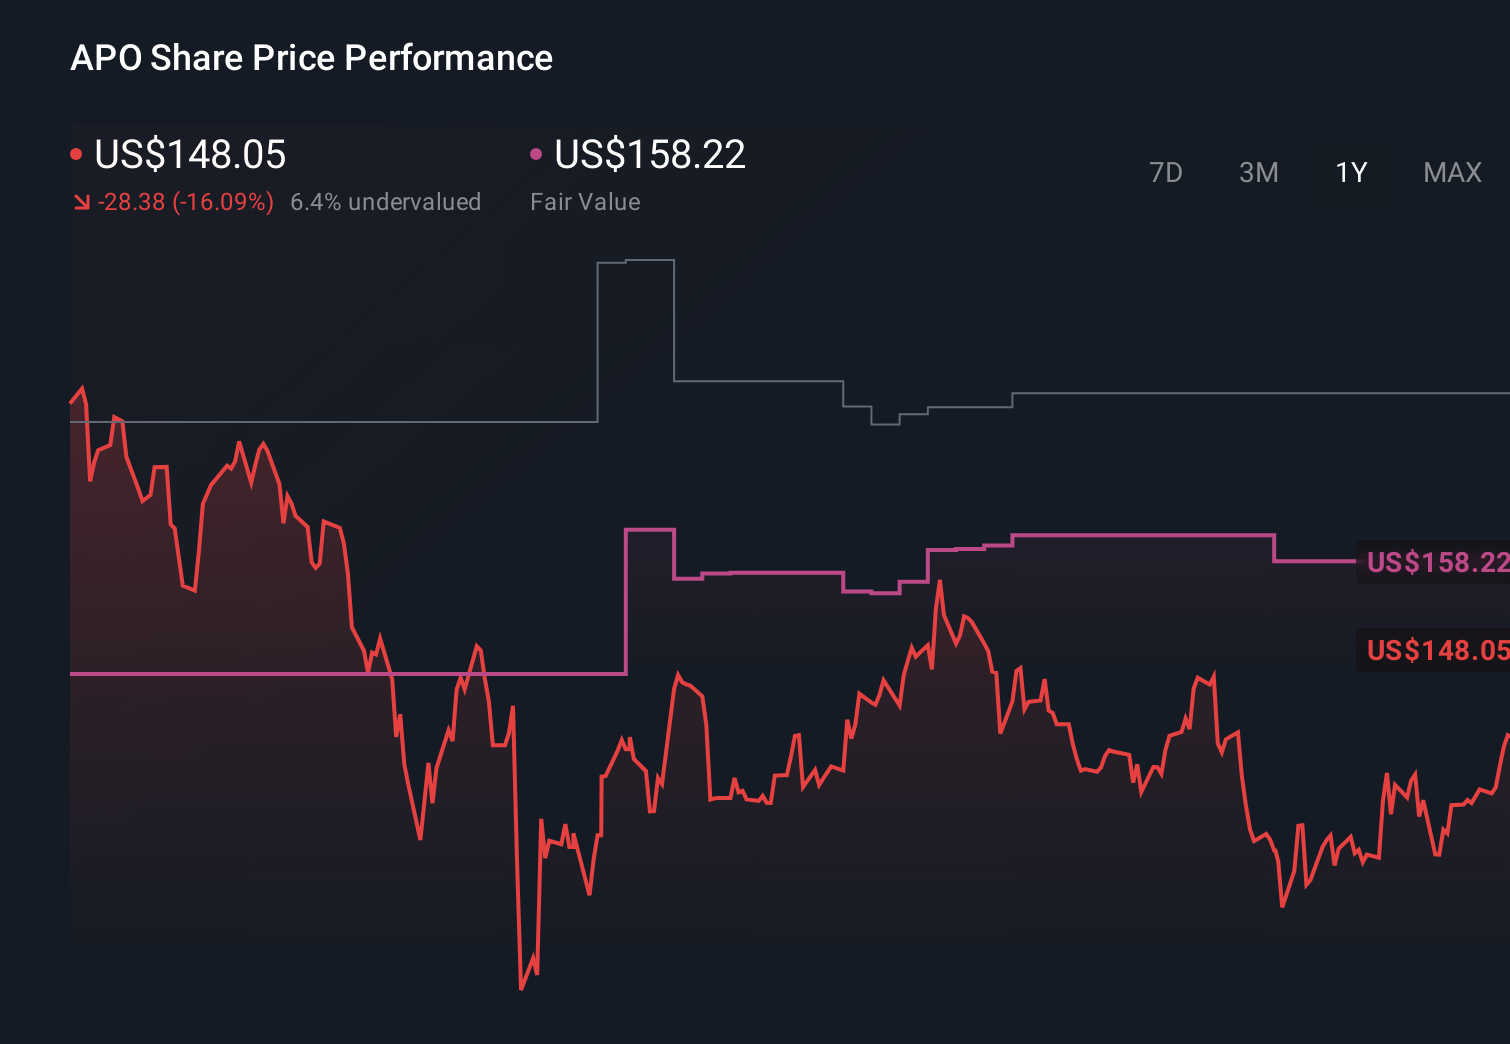
On Simply Wall St, millions of investors build and share these Narratives on the Community page. They compare their Fair Value to the live share price to help inform their decisions and see their view refresh automatically when new earnings, news or other data are added to the platform.
For Apollo Global Management, one investor might set a high fair value with relatively strong revenue and margin assumptions, while another chooses a much lower fair value with more conservative estimates, and both Narratives can sit side by side so you can see exactly how different stories lead to different numbers.
Do you think there's more to the story for Apollo Global Management? Head over to our Community to see what others are saying!
This article by Simply Wall St is general in nature. We provide commentary based on historical data and analyst forecasts only using an unbiased methodology and our articles are not intended to be financial advice. It does not constitute a recommendation to buy or sell any stock, and does not take account of your objectives, or your financial situation. We aim to bring you long-term focused analysis driven by fundamental data. Note that our analysis may not factor in the latest price-sensitive company announcements or qualitative material. Simply Wall St has no position in any stocks mentioned.