Has Barrick Gold’s Recent 97% Rally Changed Its True Value?
Barrick Mining B | 41.64 | -1.33% |
Wondering whether Barrick Mining stock deserves a spot in your portfolio is a valid question right now, especially with its price chart making some big moves lately. If you blinked, you might have missed a wild ride: the stock is up a massive 97.4% year-to-date, with a 55.0% jump over the past year and an eye-popping 116.2% gain over three years. Sure, the last week and month have given back a bit of ground, dipping 9.1% and 10.8% respectively, but in the grand scheme, Barrick’s long-term trajectory has caught a lot of investors’ attention.
Recent headlines have helped fuel that buzz. Barrick’s newest strategic partnerships and expansion projects have positioned the company for stronger global production in the coming years, which has been a key narrative shaping investor sentiment and risk perception. While none of this guarantees smooth sailing, it is clear that the broader sector narrative—such as rising gold prices, improved operational efficiency, and growing demand for safe-haven assets—has benefited Barrick more than most.
Of course, price action is only one part of the story; valuation is where we start to see just how attractive Barrick Mining really is. Our initial scorecard checks show the company is undervalued in 3 out of 6 key metrics, giving it a value score of 3. Next up, let’s dig into what those valuation methods actually say about the company, and why a more holistic view might give you even better insights than just the numbers alone.
Approach 1: Barrick Mining Discounted Cash Flow (DCF) Analysis
The Discounted Cash Flow (DCF) model estimates a company's intrinsic value by projecting its future cash flows and discounting them back to today using an appropriate rate. This helps investors gauge whether a stock’s current price is justified based on its expected financial performance.
Barrick Mining’s most recent Free Cash Flow is $1.43 Billion, which serves as a solid foundation for future forecasts. Analyst estimates suggest Free Cash Flow will climb steadily over the next five years and reach $2.42 Billion by 2029. Looking further ahead, Simply Wall St extrapolates out to 2035 and projects nearly $1.81 Billion in Free Cash Flow, with most years in between staying above the $1 Billion mark. All projections are in US Dollars.
Despite robust cash generation, the DCF calculation gives Barrick Mining an estimated intrinsic share value of $23.79. Comparing this with the current stock price, the model suggests the stock is trading at a premium of roughly 32.5%, which indicates it is overvalued based on this method.
Result: OVERVALUED
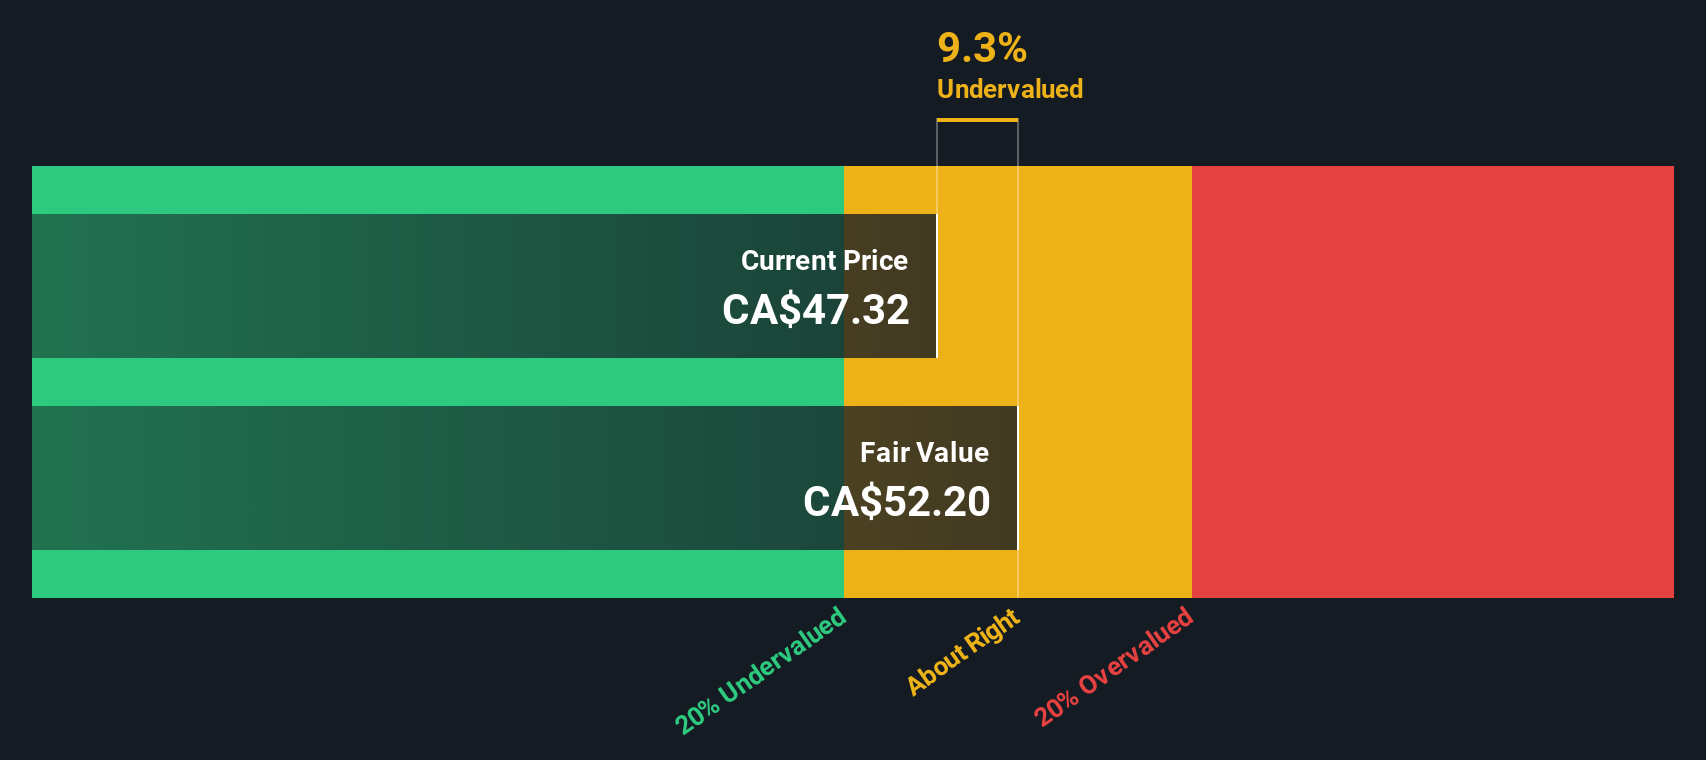
Our Discounted Cash Flow (DCF) analysis suggests Barrick Mining may be overvalued by 32.5%. Find undervalued stocks or create your own screener to find better value opportunities.
Approach 2: Barrick Mining Price vs Earnings (PE)
For profitable companies like Barrick Mining, the Price-to-Earnings (PE) ratio is one of the most widely used valuation tools. It helps investors understand how much they are paying for each dollar of the company’s earnings. Generally, a “normal” or “fair” PE ratio depends on a range of factors, including how quickly a company’s earnings are expected to grow and the risks investors perceive in those future earnings. The higher the growth or the lower the risk, the more investors are typically willing to pay, which drives up the PE ratio.
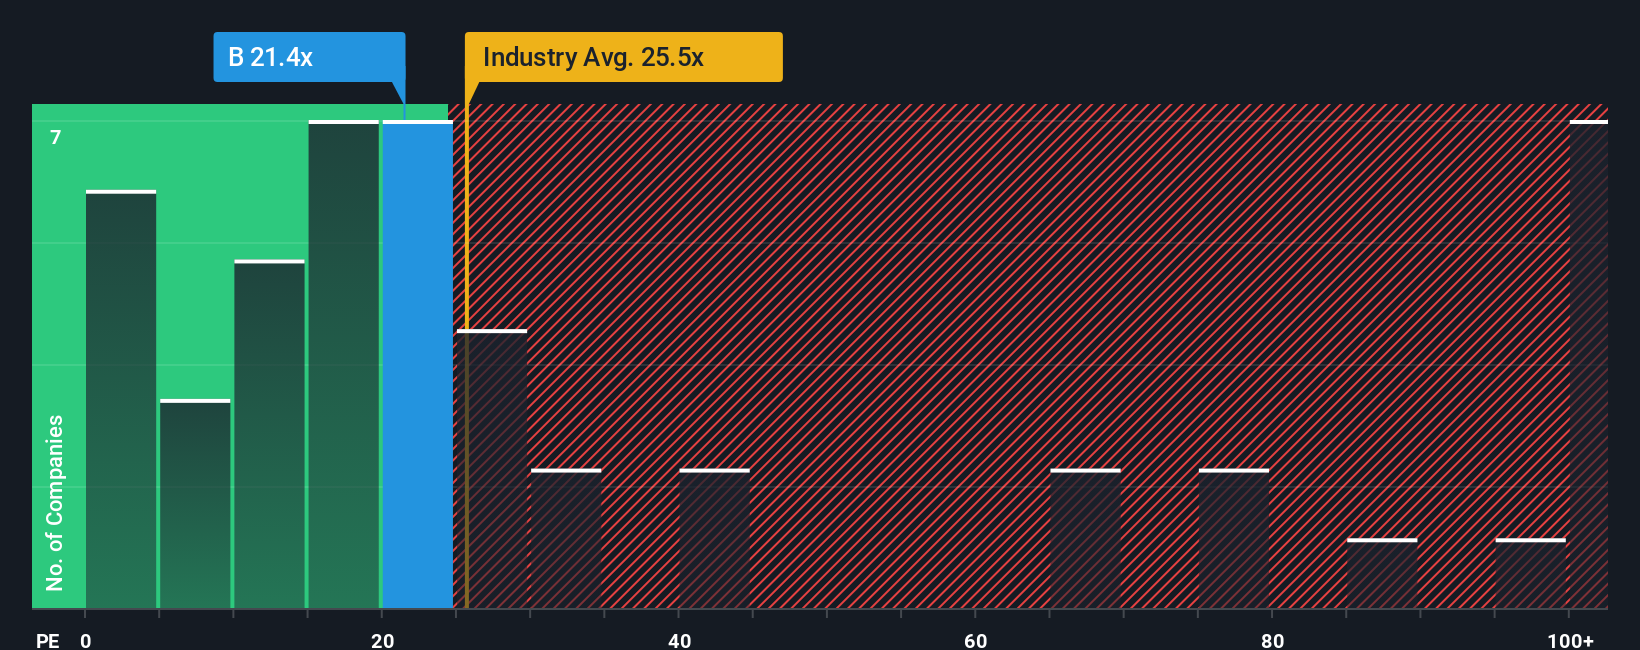
Barrick Mining currently trades at a PE ratio of 19.5x. For perspective, the average PE ratio for Metals and Mining companies sits at 25.5x, and key peers average about 22.1x. At first glance, Barrick appears cheaper than both the industry and its peer group, which can make it look like a bargain buy.
However, Simply Wall St’s proprietary “Fair Ratio” refines this assessment. The Fair Ratio predicts what Barrick’s PE should be by considering additional factors such as earnings growth, profitability, market cap, industry conditions, and risk profile. This makes the Fair Ratio a more holistic benchmark because it adjusts for nuances that simple peer or industry comparisons often miss. For Barrick, the Fair Ratio is calculated at 29.6x, which means the company’s current 19.5x PE is notably lower than what you would expect after accounting for all these dynamics.
Result: UNDERVALUED
PE ratios tell one story, but what if the real opportunity lies elsewhere? Discover companies where insiders are betting big on explosive growth.
Upgrade Your Decision Making: Choose your Barrick Mining Narrative
Earlier we mentioned there is an even better way to understand valuation, so let's introduce you to Narratives, a fresh, practical approach for connecting a company's story to its numbers and truly framing your investment decisions.
Narratives are simply your investment thesis made visible. You write your perspective on Barrick Mining’s future in plain language, then translate it into projected growth, margins, and other key financial assumptions. The Narrative ties this company’s real-world story to a financial forecast and, finally, to an estimated fair value. This transforms scattered facts and forecasts into a clear and actionable picture.
Best of all, anyone can build and refine their own Narrative using tools found right on Simply Wall St’s Community page, where millions of investors compare, share, and test their views in real time. Narratives update dynamically as soon as new news or fresh quarterly results come in, making them a living reflection of both the market and your reasoning.
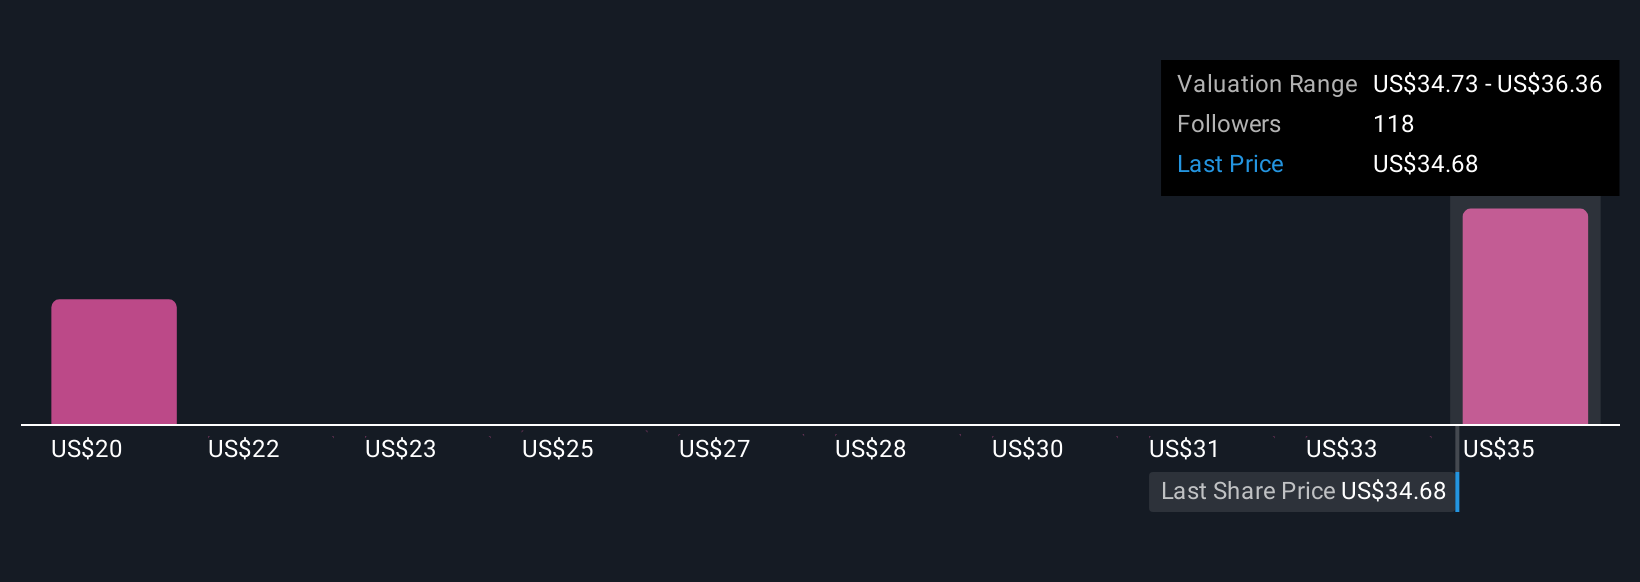
This helps you confidently decide whether to buy, sell, or hold Barrick by seeing the current price against your Narrative's fair value. For instance, one investor might anticipate steady 4.5% revenue growth, gold at $3,000/oz, and forecast Barrick’s fair value at $20.44. Another might anticipate a commodity supercycle and rapid copper expansion, modeling aggressive 20.2% growth and a fair value of $36. Both perspectives coexist, and you can see which story best matches your outlook.
Do you think there's more to the story for Barrick Mining? Create your own Narrative to let the Community know!
This article by Simply Wall St is general in nature. We provide commentary based on historical data and analyst forecasts only using an unbiased methodology and our articles are not intended to be financial advice. It does not constitute a recommendation to buy or sell any stock, and does not take account of your objectives, or your financial situation. We aim to bring you long-term focused analysis driven by fundamental data. Note that our analysis may not factor in the latest price-sensitive company announcements or qualitative material. Simply Wall St has no position in any stocks mentioned.