Has Euronet Worldwide (EEFT) Fallen Too Far Given Current Earnings And Valuation Signals
Euronet Worldwide, Inc. EEFT | 0.00 |
- Wondering whether Euronet Worldwide at US$67.78 is a potential bargain or a value trap? This article walks through the key signals you need to weigh before deciding how it fits in your portfolio.
- The stock has had a tough run, with the share price down 3.0% over the past week, 9.9% over the last month, 8.5% year to date, and 36.3% over the past year. This adds to a 39.8% decline over three years and 54.0% over five years.
- Recent headlines around Euronet Worldwide have focused on its position within diversified financial services and market reactions to changing expectations around its business mix and growth profile. This context helps explain why sentiment has weakened and why valuation has become such a focal point for many investors.
- Even with this track record, Euronet Worldwide currently scores a full 6/6 valuation checks. The sections that follow will compare common valuation approaches and then finish with a broader framework that can help you judge whether that score really matches the story you see.
Approach 1: Euronet Worldwide Excess Returns Analysis
The Excess Returns model asks a simple question: is Euronet Worldwide earning more on its equity than investors require, and if so, how much value does that create over time? Instead of focusing on cash flows, it looks at earnings relative to the cost of equity and the company’s book value per share.
For Euronet Worldwide, book value is $31.82 per share, with a stable book value estimate of $28.10 per share, both based on median figures from the past 5 years. Stable EPS is $6.77 per share, sourced from the median return on equity over that period, while the cost of equity is $2.53 per share. The difference between those two, an excess return of $4.23 per share, is what this model treats as the core value driver.
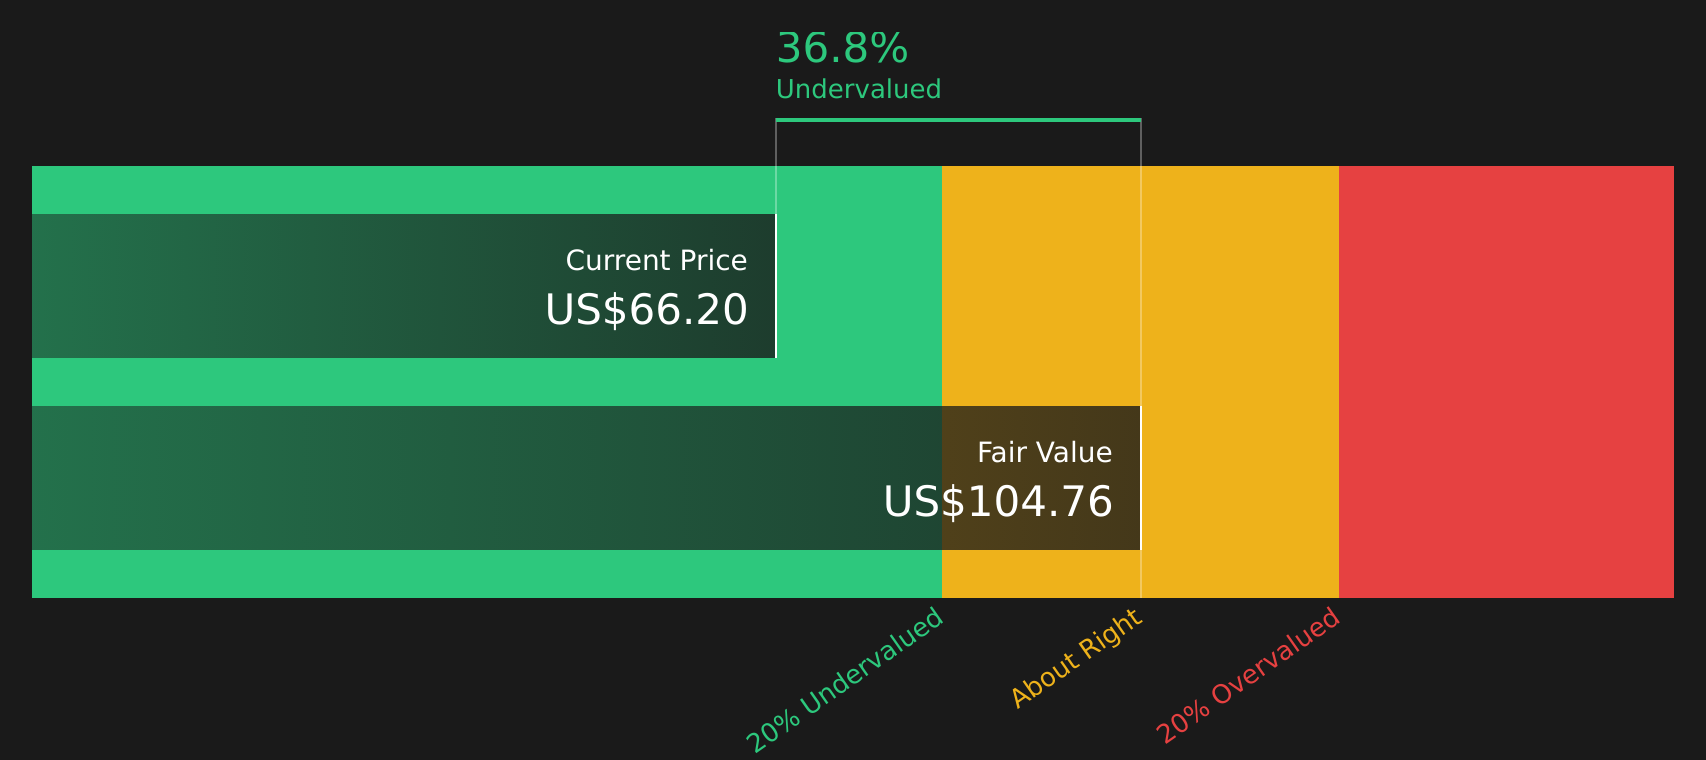
Using these inputs, the Excess Returns model arrives at an estimated intrinsic value of $105.34 per share. Compared with the recent share price of $67.78, this implies the stock is 35.7% undervalued according to this framework.
Result: UNDERVALUED
Our Excess Returns analysis suggests Euronet Worldwide is undervalued by 35.7%. Track this in your watchlist or portfolio, or discover 51 more high quality undervalued stocks.
Approach 2: Euronet Worldwide Price vs Earnings
For profitable companies, the P/E ratio is a useful way to link what you pay for the stock to the earnings the business is currently generating. It helps you see how many dollars investors are willing to pay for each dollar of earnings.
What counts as a "normal" P/E depends on how the market views a company’s growth prospects and risks. Higher expected growth and lower perceived risk usually support a higher multiple, while slower growth or higher risk tend to justify a lower one.
Euronet Worldwide currently trades on a P/E of 8.36x. This sits below the Diversified Financial industry average P/E of 17.90x and slightly below the peer group average of 8.86x. Simply Wall St’s Fair Ratio for Euronet Worldwide is 13.64x, which reflects a proprietary view of what its P/E might be given factors such as earnings growth profile, profit margins, industry, market cap and risk characteristics.
The Fair Ratio is more tailored than a simple peer or industry comparison because it adjusts for the company’s specific fundamentals rather than assuming all stocks in the group deserve similar multiples. Comparing the current P/E of 8.36x with the Fair Ratio of 13.64x suggests the stock screens as undervalued on this metric.
Result: UNDERVALUED

P/E ratios tell one story, but what if the real opportunity lies elsewhere? Start investing in legacies, not executives. Discover our 20 top founder-led companies.
Upgrade Your Decision Making: Choose your Euronet Worldwide Narrative
Earlier it was mentioned that there is an even better way to think about valuation. Narratives on Simply Wall St let you attach a clear story about Euronet Worldwide to concrete numbers such as your preferred fair value, revenue, earnings and margin estimates. You can then tie that story to a live forecast and a fair value that you can compare with the current share price to see whether the stock looks expensive or cheap to you. This all happens inside an easy tool on the Community page that automatically refreshes when new news or earnings are added. One investor might build a bullish Euronet Worldwide Narrative that lines up with a higher fair value such as US$145.0, while another might set up a more cautious Narrative closer to US$75.0. Both can quickly see how their view stacks up against the current market price and decide whether that difference justifies acting or waiting.
Do you think there's more to the story for Euronet Worldwide? Head over to our Community to see what others are saying!

This article by Simply Wall St is general in nature. We provide commentary based on historical data and analyst forecasts only using an unbiased methodology and our articles are not intended to be financial advice. It does not constitute a recommendation to buy or sell any stock, and does not take account of your objectives, or your financial situation. We aim to bring you long-term focused analysis driven by fundamental data. Note that our analysis may not factor in the latest price-sensitive company announcements or qualitative material. Simply Wall St has no position in any stocks mentioned.