Has Harley-Davidson (HOG) Rerating Gone Too Far After Recent Share Price Rebound
Harley-Davidson, Inc. HOG | 0.00 |
- Some investors may be wondering whether Harley-Davidson's current share price still reflects its true worth, or if the brand's appeal is masking what they are really paying for.
- The stock closed at US$23.62, with returns of 3.0% over 7 days, 21.5% over 30 days, 14.4% year to date, 8.8% over 1 year, but longer term returns of a 28.6% decline over 3 years and a 46.8% decline over 5 years, which can change how investors think about both potential upside and risk.
- Recent coverage has focused on how Harley-Davidson's share price performance over different time frames shapes sentiment around the stock, and whether shorter term gains sit comfortably alongside weaker multi year returns. That context has put a spotlight on whether the current price still lines up with the underlying business and its long term appeal.
- Harley-Davidson currently holds a valuation score of 3 out of 6. The rest of this article will compare what different valuation approaches suggest about the stock and will finish by looking at a more complete way to think about value that goes beyond a single number.
Approach 1: Harley-Davidson Discounted Cash Flow (DCF) Analysis
A Discounted Cash Flow, or DCF, model estimates what a company could be worth by projecting future cash flows and discounting them back to today using a required return. It is essentially asking what those future dollars are worth in present day terms.
For Harley-Davidson, the model used is a 2 Stage Free Cash Flow to Equity approach. The latest twelve month free cash flow stands at about $408 million. Analyst and extrapolated estimates then project free cash flow over the coming years, with a ten year path that includes a forecast of $242.1 million in 2028 and further extrapolated figures out to 2035, all expressed in dollars and then discounted to today.
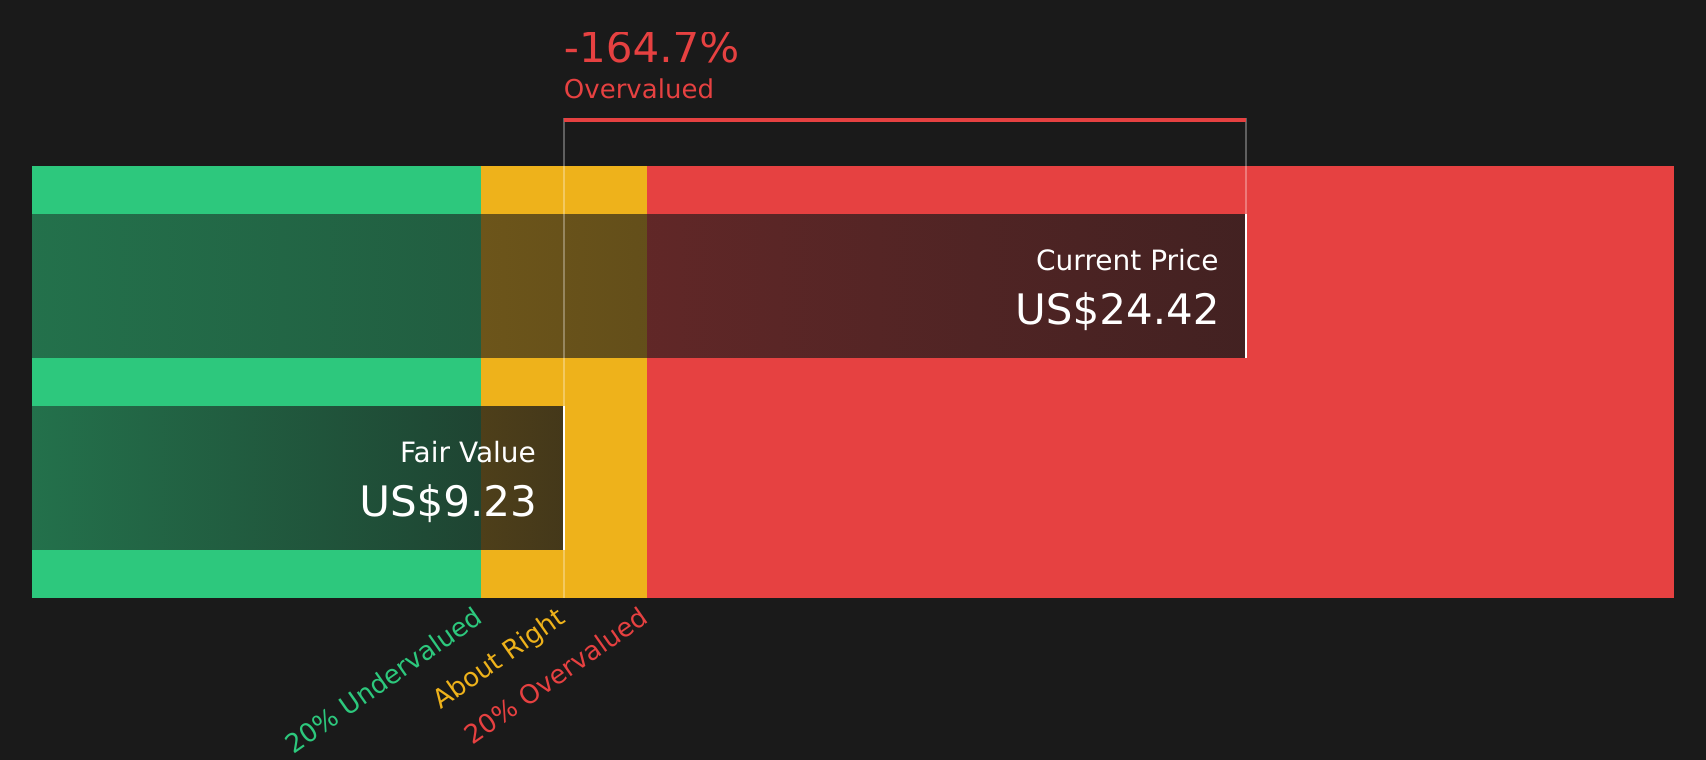
Pulling those cash flow projections together, the DCF model produces an estimated intrinsic value of about $16.25 per share. Compared with the recent share price of US$23.62, this suggests the stock is roughly 45.4% overvalued using this method.
Result: OVERVALUED
Our Discounted Cash Flow (DCF) analysis suggests Harley-Davidson may be overvalued by 45.4%. Discover 53 high quality undervalued stocks or create your own screener to find better value opportunities.
Approach 2: Harley-Davidson Price vs Earnings
For a profitable company, the P/E ratio is a straightforward way to link what you pay for each share to the earnings that support it. It essentially tells you how many dollars investors are willing to pay today for one dollar of current earnings.
What counts as a "normal" or "fair" P/E depends on expectations for future growth and the level of risk investors see in those earnings. Higher expected growth or lower perceived risk can support a higher P/E, while slower expected growth or higher risk usually points to a lower multiple.
Harley-Davidson currently trades on a P/E of 7.80x. That sits below the Auto industry average P/E of 18.79x and a peer average of 19.24x. Simply Wall St's Fair Ratio for Harley-Davidson is 8.12x, which is its proprietary view of what the P/E ought to be based on factors such as earnings growth, industry, profit margin, market cap and risks. This is more tailored than a simple comparison with peers or the sector because it adjusts for the company's own profile rather than assuming it should trade like the average stock.
Comparing the Fair Ratio of 8.12x with the current 7.80x P/E suggests the shares look undervalued on this metric.
Result: UNDERVALUED

P/E ratios tell one story, but what if the real opportunity lies elsewhere? Start investing in legacies, not executives. Discover our 18 top founder-led companies.
Upgrade Your Decision Making: Choose your Harley-Davidson Narrative
Earlier it was mentioned that there is an even better way to think about valuation. On Simply Wall St this takes the form of Narratives, where you choose a story for Harley-Davidson, link that story to specific forecasts for revenue, earnings and margins, and get a Fair Value that you can compare to the current price to decide whether the shares look attractive. The tool is available on the Community page and updates automatically when new news or earnings arrive. You can see, for example, how a more optimistic Harley-Davidson view that lines up with a Fair Value around the US$32.00 bullish target compares with a more cautious view closer to the US$20.00 bearish target, and decide which one better matches how you see the business.
For Harley-Davidson however, we will make it really easy for you with previews of two leading Harley-Davidson Narratives:
Fair Value: US$32.00 per share
Implied discount to this Fair Value vs the last close of US$23.62: about 26.2% undervalued
Revenue trend used in this narrative: 6.09% annual revenue decline
- Backers of this view are focused on brand reach, younger riders and new, more affordable models as drivers that could support the business even if headline revenue and margins soften.
- The narrative leans on cost savings, capital light finance operations and ongoing buybacks to shape earnings per share and return on equity over time.
- To line up with this view, you would need to be comfortable with lower revenue and profit margins but a higher future P/E and reduced share count helping support a Fair Value around US$32.00.
Fair Value: US$22.14 per share
Implied premium to this Fair Value vs the last close of US$23.62: about 6.7% overvalued
Revenue trend used in this narrative: 5.61% annual revenue decline
- This view leans on weaker motorcycle demand, dealer concerns and slower progress in electric models, with analysts using lower profit margins and a reduced future P/E to set expectations.
- It still factors in benefits from buybacks, brand work and new lower priced models, but balances these against tariffs, macro pressures and an aging core customer base.
- To agree with this narrative, you would need to accept that revenue and earnings step down toward the analyst consensus fair value region near US$22.14, with limited upside from the current share price.
Putting these side by side helps you decide which assumptions feel closer to how you see Harley-Davidson, and whether the recent share price sits nearer to your own version of fair value or not.
To see how these results tie into long-term growth, risks, and valuation, check out the full range of community narratives for Harley-Davidson on Simply Wall St. Add the company to your watchlist or portfolio so you'll be alerted when the story evolves.
Do you think there's more to the story for Harley-Davidson? Head over to our Community to see what others are saying!

This article by Simply Wall St is general in nature. We provide commentary based on historical data and analyst forecasts only using an unbiased methodology and our articles are not intended to be financial advice. It does not constitute a recommendation to buy or sell any stock, and does not take account of your objectives, or your financial situation. We aim to bring you long-term focused analysis driven by fundamental data. Note that our analysis may not factor in the latest price-sensitive company announcements or qualitative material. Simply Wall St has no position in any stocks mentioned.