Has Ingersoll Rand (IR) Run Too Far After Its Recent Share Price Surge?
Ingersoll Rand Inc. IR | 88.32 88.32 | +0.72% 0.00% Pre |
- If you are wondering whether Ingersoll Rand shares still offer value at current levels, this article will walk through what the numbers are really saying about the stock.
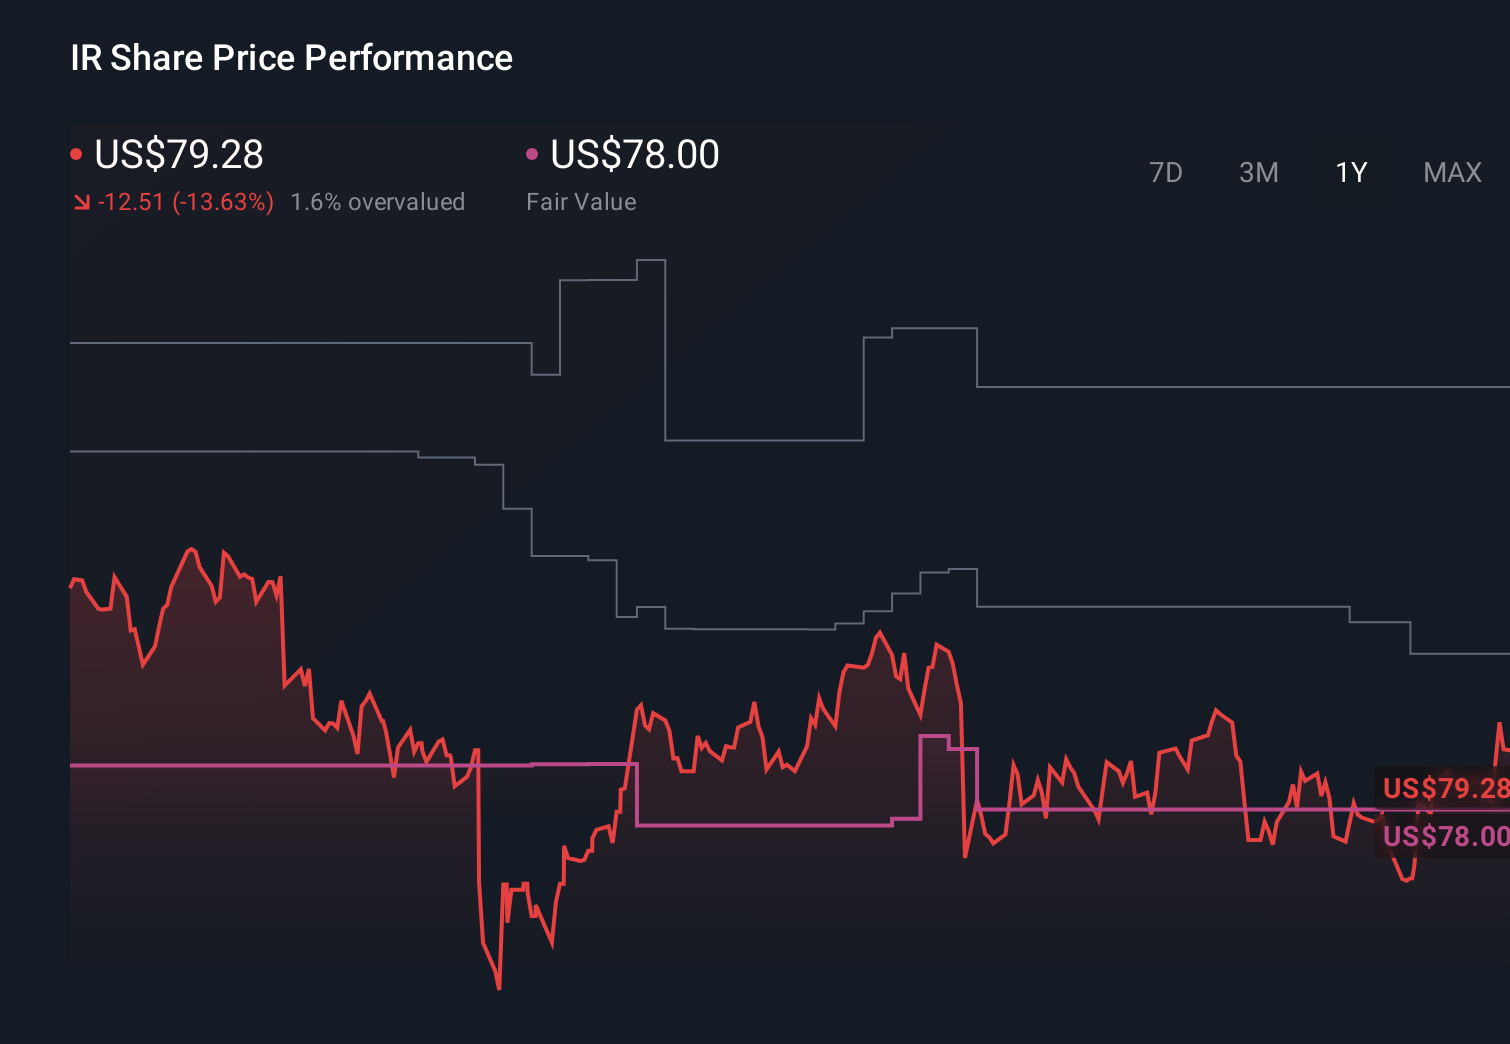
- The share price recently closed at US$96.00, with returns of 8.0% over 7 days, 15.1% over 30 days, 20.4% year to date, 4.0% over 1 year, 70.6% over 3 years, and 119.1% over 5 years. These figures may affect how you think about upside and risk today.
- Recent attention on Ingersoll Rand has focused on how the share price performance lines up with broader interest in industrial and capital goods names, as investors reassess where they want long term exposure. This backdrop provides important context when you weigh up whether the current price fairly reflects the company’s fundamentals.
- On our valuation checks, Ingersoll Rand currently scores 0 out of 6. Next, we will look at how different valuation approaches interpret that result before finishing with a framework that can help you think about value in a more rounded way.
Ingersoll Rand scores just 0/6 on our valuation checks. See what other red flags we found in the full valuation breakdown.
Approach 1: Ingersoll Rand Discounted Cash Flow (DCF) Analysis
A Discounted Cash Flow, or DCF, model estimates what a company might be worth by projecting its future cash flows and discounting them back to today, using a required rate of return.
For Ingersoll Rand, the model uses last twelve months Free Cash Flow of about US$1.25b. Analysts supply nearer term forecasts, then Simply Wall St extrapolates further out, including a projected Free Cash Flow of US$2.04b in 2035 based on a 2 Stage Free Cash Flow to Equity approach.
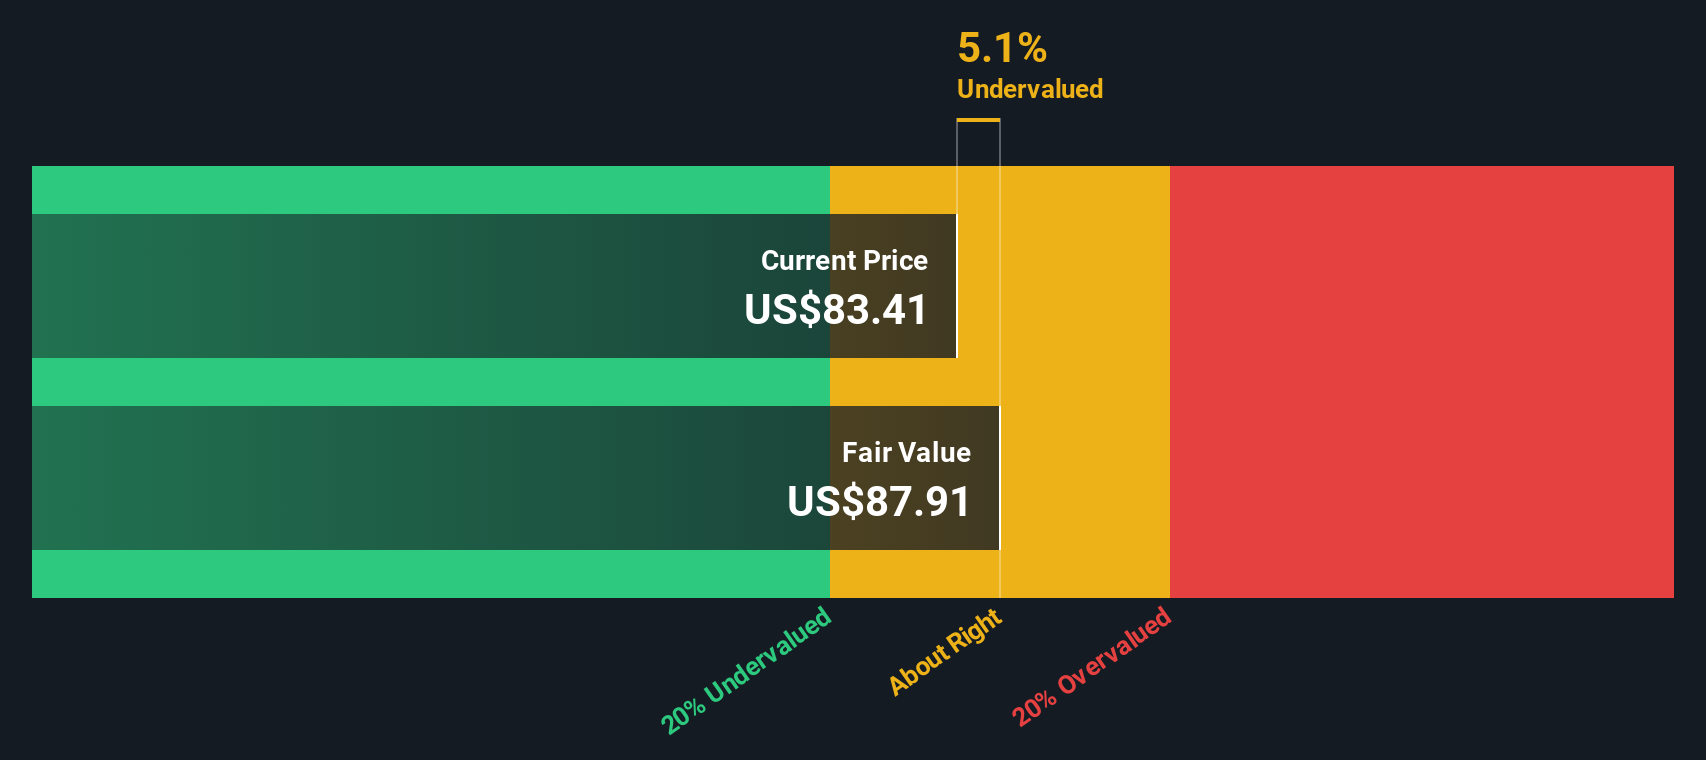
Those yearly projections are discounted to today and summed to arrive at an estimated intrinsic value of US$73.51 per share. Compared with the recent share price of US$96.00, this implies the stock is about 30.6% above the DCF estimate. Based on these cash flow assumptions, the model indicates that the shares are trading at a premium.
Result: OVERVALUED
Our Discounted Cash Flow (DCF) analysis suggests Ingersoll Rand may be overvalued by 30.6%. Discover 55 high quality undervalued stocks or create your own screener to find better value opportunities.
Approach 2: Ingersoll Rand Price vs Earnings
For profitable companies, the P/E ratio is a useful way to check how much you are paying for each dollar of earnings. It quickly links the share price to the underlying profit, which is usually what drives returns over time.
What counts as a “normal” P/E often depends on how fast earnings are expected to grow and how risky those earnings are. Higher growth or lower perceived risk can justify a higher multiple, while slower growth or higher uncertainty tends to go with a lower one.
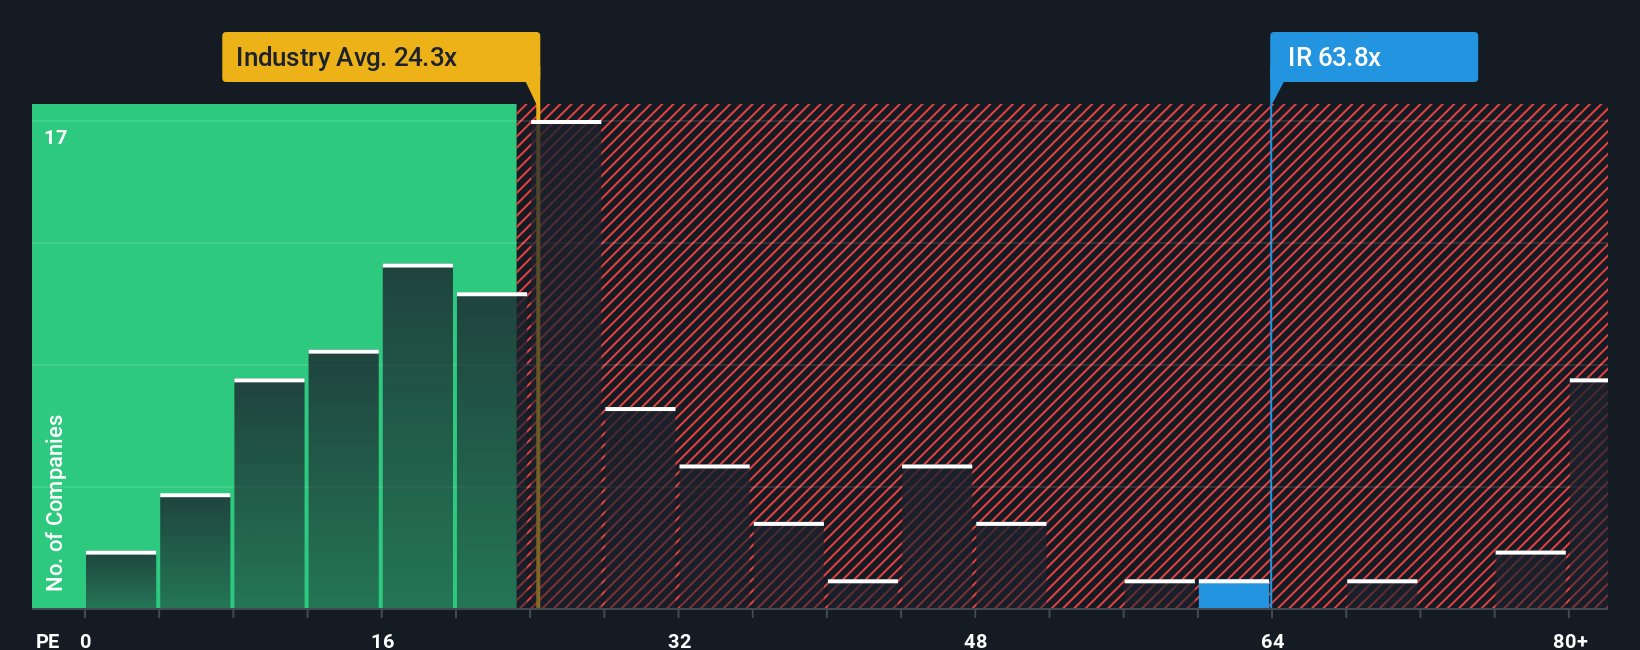
Ingersoll Rand currently trades on a P/E of 69.58x, compared with the Machinery industry average of about 27.89x and a peer average of 26.91x. Simply Wall St’s Fair Ratio framework estimates a P/E of 43.41x for Ingersoll Rand, which it calculates using factors such as earnings growth, industry, profit margins, market cap and company specific risks.
This Fair Ratio approach can be more tailored than a simple peer or industry comparison because it adjusts for the company’s own characteristics rather than treating all Machinery stocks as equal. Comparing 69.58x with the 43.41x Fair Ratio suggests the shares are pricing in a richer valuation than this framework implies.
Result: OVERVALUED
P/E ratios tell one story, but what if the real opportunity lies elsewhere? Start investing in legacies, not executives. Discover our 22 top founder-led companies.
Upgrade Your Decision Making: Choose your Ingersoll Rand Narrative
Earlier we mentioned that there is an even better way to understand valuation, so let us introduce you to Narratives, a simple tool that lets you attach a story to your numbers by linking your view on a company’s future revenue, earnings and margins to a forecast and then to an assumed fair value. On Simply Wall St’s Community page, used by millions of investors, you can pick or create a Narrative for Ingersoll Rand that reflects your perspective, compare the Fair Value from that Narrative to today’s share price, and use that gap to help decide whether the stock looks attractive or stretched on your terms. Narratives are kept current as new information like company news or earnings is added, so the story and the valuation update together rather than going stale. For example, one Ingersoll Rand Narrative might assume a relatively high fair value based on stronger revenue and margin expectations, while another might point to a lower fair value based on more cautious assumptions about future profitability.
Do you think there's more to the story for Ingersoll Rand? Head over to our Community to see what others are saying!
This article by Simply Wall St is general in nature. We provide commentary based on historical data and analyst forecasts only using an unbiased methodology and our articles are not intended to be financial advice. It does not constitute a recommendation to buy or sell any stock, and does not take account of your objectives, or your financial situation. We aim to bring you long-term focused analysis driven by fundamental data. Note that our analysis may not factor in the latest price-sensitive company announcements or qualitative material. Simply Wall St has no position in any stocks mentioned.