

Has Jumia Technologies (JMIA) Run Too Far After Its 196% One-Year Share Price Surge?
JUMIA JMIA | 0.00 |
- If you are wondering whether Jumia Technologies is still attractively priced after its recent volatility, you are not alone. This article will walk through what the current market price might be implying.
- The stock last closed at US$12.27, with returns of 195.7% over 1 year and 225.5% over 3 years, alongside shorter term moves of a 0.7% decline over 7 days, a 14.0% decline over 30 days, and a 4.4% decline year to date.
- These mixed returns, strong over several years but weaker in the near term, suggest that sentiment around Jumia has shifted more than once. That kind of pattern often reflects changing expectations about the business, risk and growth potential. We will unpack this through a structured look at its value.
- On our simple valuation checks, Jumia currently scores 0 out of 6, as shown in its valuation scorecard. Next we will compare different valuation approaches for the stock and then finish with a broader toolkit for thinking about value that goes beyond any single model.
Jumia Technologies scores just 0/6 on our valuation checks. See what other red flags we found in the full valuation breakdown.
Approach 1: Jumia Technologies Discounted Cash Flow (DCF) Analysis
A Discounted Cash Flow, or DCF, model projects a company’s future cash flows and then discounts those back to today’s dollars to estimate what the whole business might be worth now.
For Jumia Technologies, the latest twelve month free cash flow is a loss of about US$76.6 million. Analysts have provided specific free cash flow estimates out to 2028, and beyond that the model extends those projections. By 2028, free cash flow is projected at about US$29.1 million, with a series of annual projections out to 2035 that move from negative to positive and are then extrapolated using various growth rates.
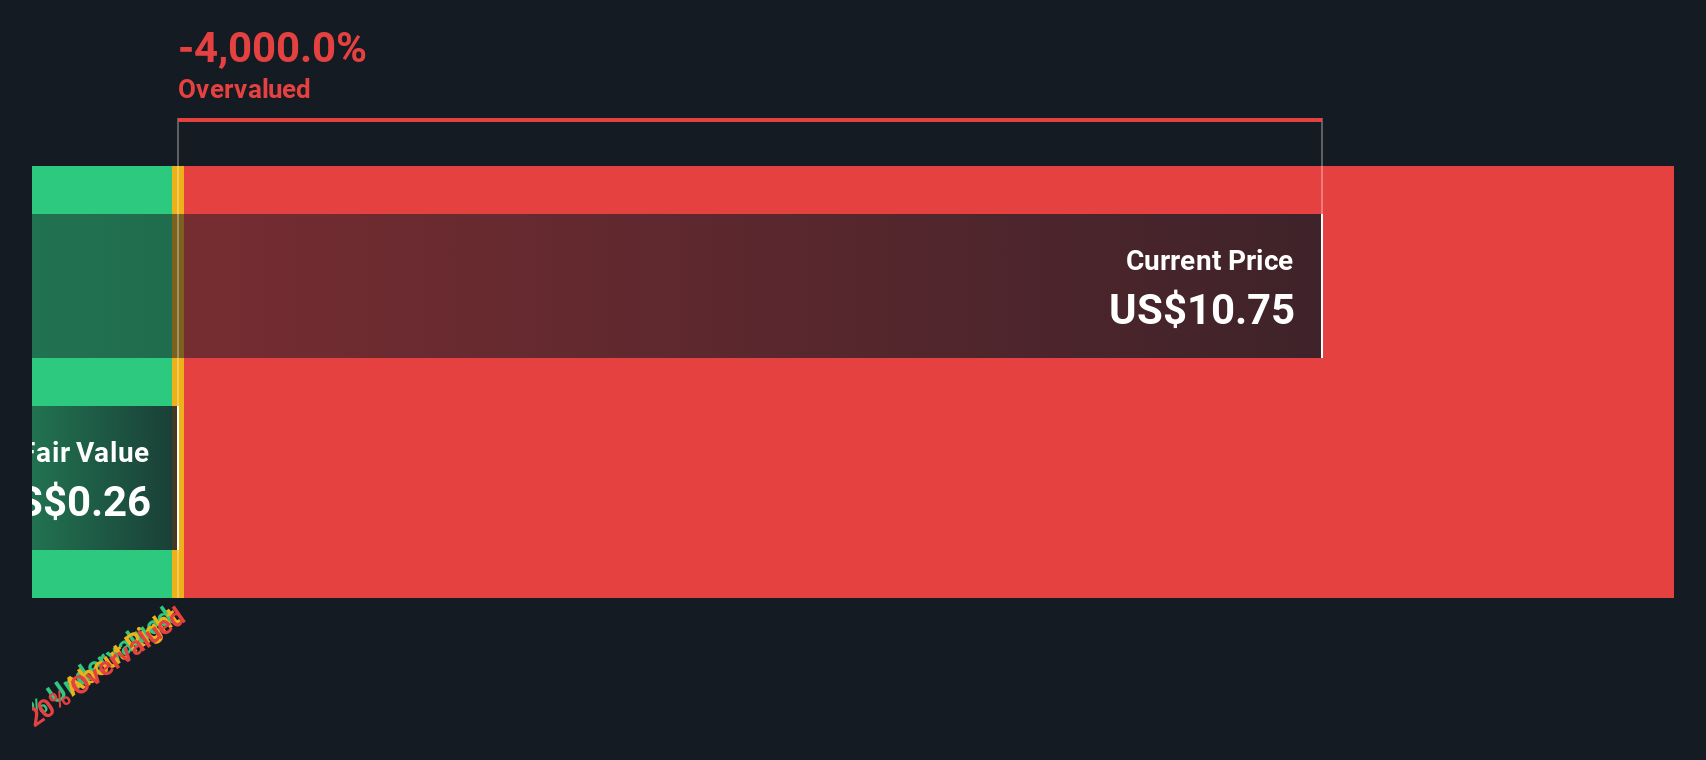
Using this 2 Stage Free Cash Flow to Equity model, the DCF output suggests an estimated intrinsic value of about US$6.01 per share, compared with the recent share price of US$12.27. On this basis, the stock screens as about 104.0% above the model’s estimate of fair value, so the DCF points to a rich valuation.
Result: OVERVALUED
Our Discounted Cash Flow (DCF) analysis suggests Jumia Technologies may be overvalued by 104.0%. Discover 52 high quality undervalued stocks or create your own screener to find better value opportunities.
Approach 2: Jumia Technologies Price vs Sales
For a business that is not yet reporting positive earnings, the P/S ratio is often a practical way to think about valuation because it relates the share price to current revenue rather than profit that might still be negative or volatile.
What investors usually pay for each dollar of sales depends a lot on growth expectations and risk. Higher expected growth and lower perceived risk can justify a higher multiple, while slower growth or higher uncertainty tend to pull that “normal” range down.
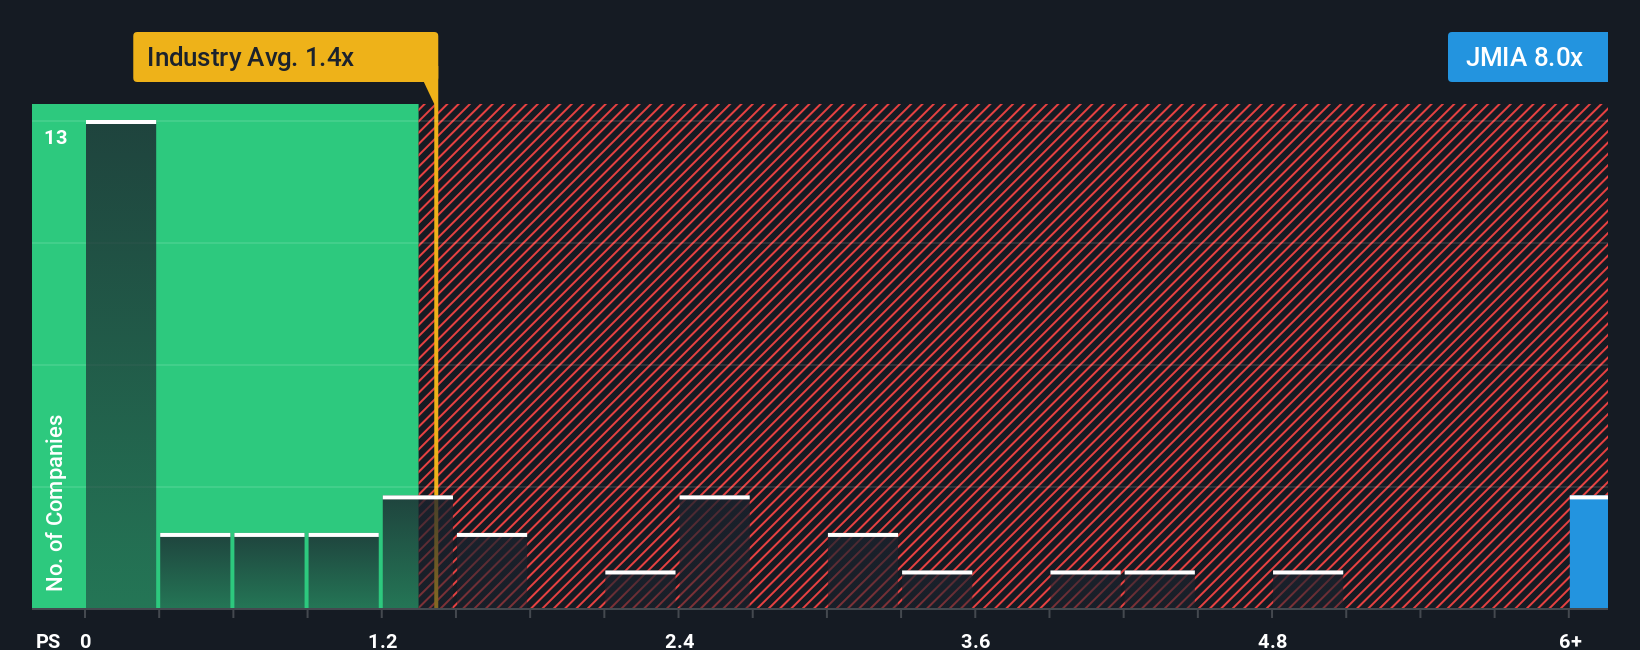
Jumia Technologies currently trades on a P/S of 8.67x. This sits well above the Multiline Retail industry average of 1.34x and the peer average of 0.81x. Simply Wall St’s Fair Ratio for Jumia, based on its P/S, is 1.46x. This is a proprietary estimate of what a reasonable multiple could be given factors like its growth profile, profit margins, industry, market cap and identified risks.
This Fair Ratio can be more informative than a simple comparison with peers or the industry because it tries to align the multiple with the company’s specific fundamentals rather than broad group averages. Compared with the current P/S of 8.67x, the Fair Ratio of 1.46x suggests the shares are pricing in a much richer level.
Result: OVERVALUED
P/S ratios tell one story, but what if the real opportunity lies elsewhere? Start investing in legacies, not executives. Discover our 22 top founder-led companies.
Upgrade Your Decision Making: Choose your Jumia Technologies Narrative
Earlier we mentioned that there is an even better way to understand valuation, so let us introduce you to Narratives, which are simple stories you create about Jumia that link your view of its future revenue, earnings and margins to a financial forecast and then to a fair value that you can easily compare with today’s share price.
On Simply Wall St’s Community page, you can pick or build a Narrative that fits your view of Jumia. For example, you might choose one where expansion, fintech and logistics gains support a fair value close to the US$6.99 analyst consensus. Alternatively, you might have a more cautious view where infrastructure gaps, cash burn and competition point to a lower figure. The platform will keep updating that Narrative as new news or earnings arrive so your story, numbers and sense of whether the price looks high or low all stay connected in one place.
Do you think there's more to the story for Jumia Technologies? Head over to our Community to see what others are saying!

This article by Simply Wall St is general in nature. We provide commentary based on historical data and analyst forecasts only using an unbiased methodology and our articles are not intended to be financial advice. It does not constitute a recommendation to buy or sell any stock, and does not take account of your objectives, or your financial situation. We aim to bring you long-term focused analysis driven by fundamental data. Note that our analysis may not factor in the latest price-sensitive company announcements or qualitative material. Simply Wall St has no position in any stocks mentioned.