Has Nucor (NUE) Run Too Far After 101% One Year Surge In Share Price
Nucor Corporation NUE | 0.00 |
- Wondering whether Nucor at around US$232 per share is offering value or stretching expectations? This article focuses squarely on what the current price may imply.
- The stock has returned 3.1% over the last 7 days, 34.6% over the last 30 days, 37.0% year to date and 101.6% over the last year, which naturally raises questions about how much future potential is already reflected in the price.
- Recent coverage of steel producers and materials suppliers has highlighted how investor attention often swings quickly between growth hopes and concerns about cyclicality. Against that backdrop, Nucor's moves have drawn interest from readers who want to understand whether the current price aligns with a more grounded view of long term value.
- Nucor currently has a value score of 3/6. The rest of this article will compare different valuation methods to that score, before finishing with a broader way to think about what valuation really means for your own investing decisions.
Approach 1: Nucor Discounted Cash Flow (DCF) Analysis
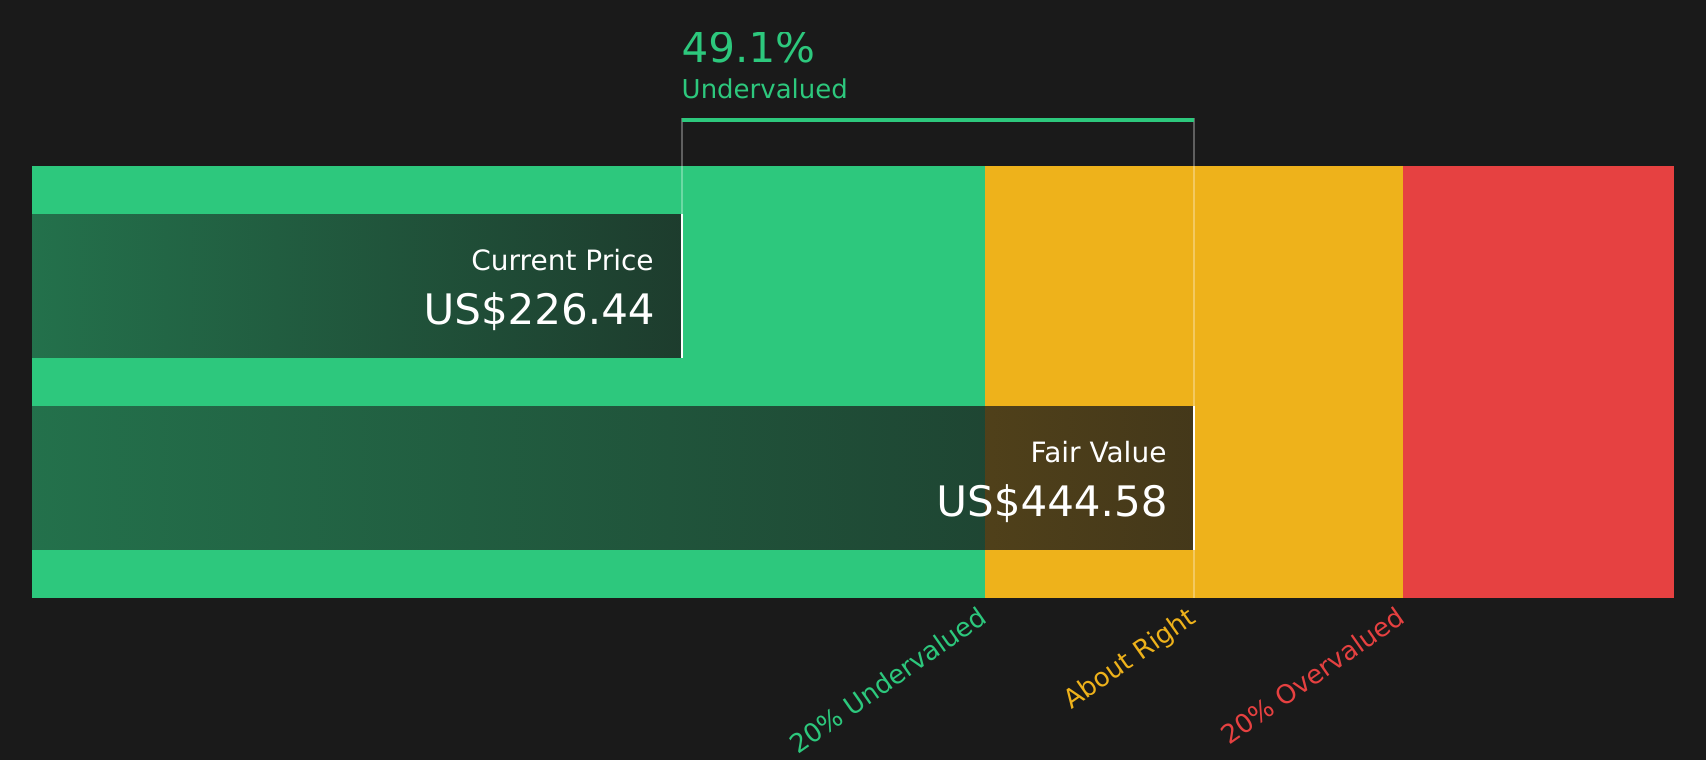
A Discounted Cash Flow model projects a company’s future cash flows and then discounts them back to today’s value, giving an estimate of what the business could be worth per share.
For Nucor, the latest twelve month Free Cash Flow is about $656.4 million. Analysts and extrapolations point to Free Cash Flow of $4,542.5 million by 2028, with a series of projected cash flows over the next decade generated using a 2 Stage Free Cash Flow to Equity model. All of these future figures are converted into today’s dollars to estimate what those cash flows are worth right now.
On this basis, the model arrives at an estimated intrinsic value of about $446.01 per share, compared with a recent share price of around $232. That gap implies the stock is roughly 48.0% undervalued according to this particular DCF snapshot.
Result: UNDERVALUED
Our Discounted Cash Flow (DCF) analysis suggests Nucor is undervalued by 48.0%. Track this in your watchlist or portfolio, or discover 51 more high quality undervalued stocks.
Approach 2: Nucor Price vs Earnings
P/E is a common way to value profitable companies because it links what you pay directly to the earnings the company is already generating. Investors generally accept paying a higher P/E when they expect stronger earnings growth or see lower risk, and a lower P/E when they see slower growth or higher risk.
Nucor currently trades on a P/E of about 22.7x. That sits slightly above the peer average of 21.1x and close to the wider Metals and Mining industry average of 22.1x. On the surface, that suggests the stock is priced roughly in line with many comparable companies.
Simply Wall St’s Fair Ratio for Nucor comes in higher, at around 27.6x. This Fair Ratio is a proprietary estimate of what P/E might be reasonable given factors such as the company’s earnings growth profile, its industry, profit margins, market cap and risk characteristics. Because it adjusts for these company specific features, it can offer a more tailored reference point than a simple comparison with peers or the broad industry.
Comparing Nucor’s actual P/E of 22.7x with the Fair Ratio of 27.6x points to the stock trading below that model based reference level.
Result: UNDERVALUED

P/E ratios tell one story, but what if the real opportunity lies elsewhere? Start investing in legacies, not executives. Discover our 19 top founder-led companies.
Upgrade Your Decision Making: Choose your Nucor Narrative
Earlier it was mentioned that there is an even better way to understand valuation. Narratives on Simply Wall St give you a clear story behind your numbers by linking your view on Nucor’s future revenue, earnings and margins to a forecast and Fair Value that you can compare with the current share price. They update automatically when new earnings or news arrive and can be tailored to your perspective, whether you lean closer to a bullish Fair Value around US$250 based on higher growth and margins or a more cautious stance nearer the lower analyst target of US$138.17. All of this is available within an easy tool on the Community page that helps you decide whether the price or your Fair Value does more of the moving.
For Nucor however we will make it really easy for you with previews of two leading Nucor Narratives:
These are not buy or sell calls, they are structured storylines that connect assumptions about revenue, margins and valuation to specific numbers so you can stress test them against your own view.
Fair Value: US$250.00
Gap vs last close: about 7.2% below this Fair Value
Assumed revenue growth: 5.91% a year
- Backs a higher Fair Value on the view that new mills, coating lines and towers and structures capacity, plus exposure to long duration projects, can support higher earnings power over time.
- Builds on bullish analyst assumptions that revenue rises at roughly 5.9% a year, profit margins lift from 6.8% to 9.9%, and earnings could reach about US$4.0b by around 2029 if execution and end market demand support those figures.
- Requires comfort that by 2029 Nucor trades on a P/E of 17.8x, below today’s multiple and below the current US Metals and Mining P/E, with a discount rate of about 8.8% used to bring those expectations back to today.
Fair Value: US$192.55
Gap vs last close: about 20.5% above this Fair Value
Assumed revenue growth: 5.84% a year
- Anchors on the analyst consensus Fair Value of roughly US$192.55, which sits below the current price and reflects a view that the market may be expecting too much from modernization spending and new capacity.
- Uses analyst assumptions of around 5.8% annual revenue growth, margins rising from 5.3% to 8.7%, and earnings of about US$3.3b by 2029, with a future P/E of 16.2x that is below today’s multiple and below the current US Metals and Mining P/E.
- Flags execution risk on large projects, sensitivity to tariff policy and raw material costs, and the possibility that even improving fundamentals might not fully support the current share price if those risks show up in the numbers.
Seen together, these narratives frame a reasonable range of outcomes around today’s price, but the key step is for you to decide which set of assumptions, if either, lines up more closely with how you think Nucor’s revenue, margins and valuation should evolve over time.
Once you have that view, you can use the Community Narratives tool to fine tune the inputs and see how your own Fair Value compares with these benchmarks and the current market price, so your decision rests on numbers you understand and assumptions you can explain.
To see how these results tie into long-term growth, risks, and valuation, check out the full range of community narratives for Nucor on Simply Wall St. Add the company to your watchlist or portfolio so you'll be alerted when the story evolves.
Do you think there's more to the story for Nucor? Head over to our Community to see what others are saying!

This article by Simply Wall St is general in nature. We provide commentary based on historical data and analyst forecasts only using an unbiased methodology and our articles are not intended to be financial advice. It does not constitute a recommendation to buy or sell any stock, and does not take account of your objectives, or your financial situation. We aim to bring you long-term focused analysis driven by fundamental data. Note that our analysis may not factor in the latest price-sensitive company announcements or qualitative material. Simply Wall St has no position in any stocks mentioned.