

Has The DuPont de Nemours (DD) Rally Left Limited Value After Portfolio Reshaping?
E. I. du Pont de Nemours and Company DD | 0.00 |
- Wondering whether DuPont de Nemours at around US$47.71 is still offering value, or if most of the opportunity has already been priced in? This article is built to help you frame that question clearly.
- The stock has recorded returns of 1.2% over the past week, 5.3% over the past month, 16.7% year to date and 69.4% over the last year, which is likely to catch the eye of investors thinking about both growth potential and changing risk perceptions.
- Recent coverage has focused on DuPont de Nemours as a major chemicals producer reshaping its portfolio through transactions and asset repositioning, alongside ongoing attention on how it allocates capital between shareholders and investment. This context is important because it often influences how investors think about what they are prepared to pay for the stock.
- On Simply Wall St's checklist, DuPont de Nemours currently has a value score of 2 out of 6. Next up is a closer look at what different valuation approaches say about the stock today and how a broader framework at the end of the article can help you interpret those signals.
DuPont de Nemours scores just 2/6 on our valuation checks. See what other red flags we found in the full valuation breakdown.
Approach 1: DuPont de Nemours Discounted Cash Flow (DCF) Analysis
A Discounted Cash Flow, or DCF, model estimates what a stock could be worth by projecting the cash the company may generate in the future and discounting those cash flows back to today in $ terms.
For DuPont de Nemours, the 2 Stage Free Cash Flow to Equity model starts with last twelve months free cash flow of about $892.3 million. Analyst and extrapolated projections, expressed in $ and mostly in the $800 million to $1.5 billion range over the next decade, are then discounted back to today using a required return estimate. Simply Wall St notes that analyst inputs generally cover up to around five years, with later years extrapolated from those assumptions.
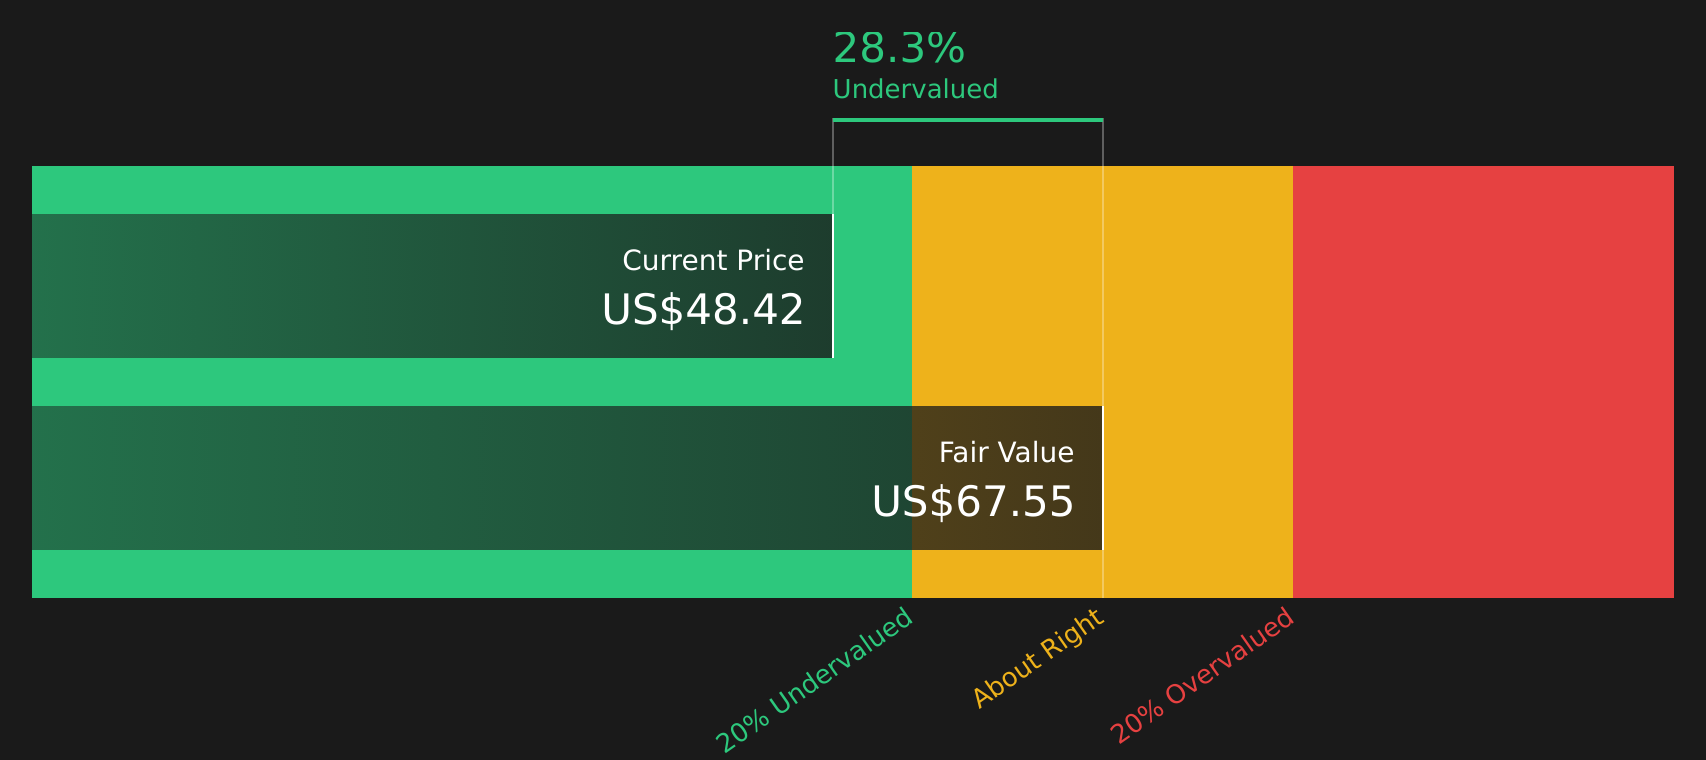
Putting these cash flows together, the model produces an estimated intrinsic value of $67.52 per share, compared with a current share price of about $47.71. That gap implies the stock screens as roughly 29.3% undervalued on this DCF view.
Result: UNDERVALUED
Our Discounted Cash Flow (DCF) analysis suggests DuPont de Nemours is undervalued by 29.3%. Track this in your watchlist or portfolio, or discover 46 more high quality undervalued stocks.
Approach 2: DuPont de Nemours Price vs Earnings
For companies that are generating profits, the P/E ratio is a useful way to think about what you are paying for each dollar of earnings. It gives a quick sense of how the market is weighing the company’s earnings profile compared with other opportunities.
What counts as a “normal” or “fair” P/E partly depends on how investors see the company’s growth outlook and risk. Higher expected growth or lower perceived risk can justify a higher multiple, while slower growth or higher risk typically line up with a lower one.
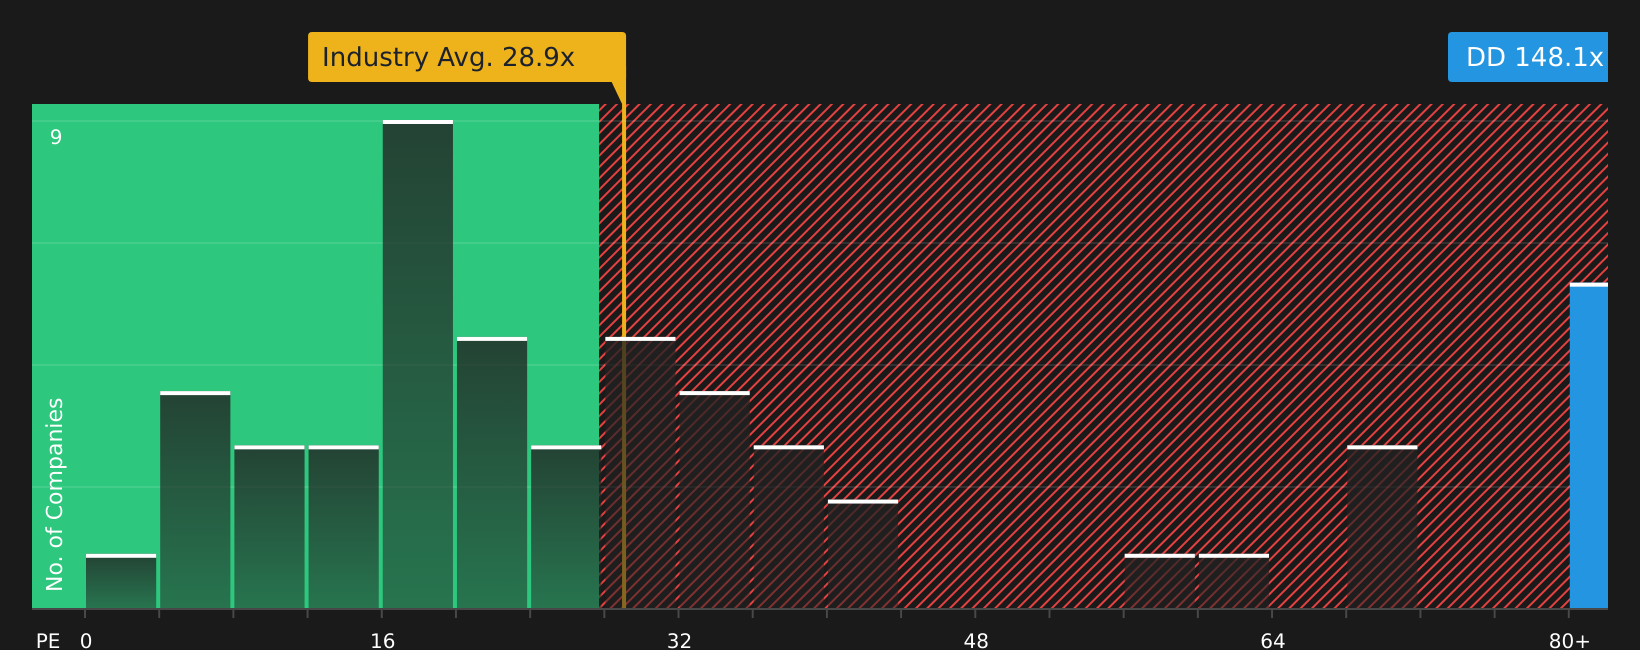
DuPont de Nemours currently trades on a P/E of 146.40x. That sits well above both the Chemicals industry average of 26.82x and the peer group average of 35.24x. Simply Wall St’s Fair Ratio for the stock is 32.53x, which is a proprietary estimate of what P/E might be reasonable given factors such as its earnings growth profile, margins, size and specific risks.
The Fair Ratio is often more helpful than a simple peer or industry comparison because it adjusts for company specific traits like growth, risk, profit margins, industry and market capitalization. Compared with this Fair Ratio of 32.53x, the current P/E of 146.40x suggests the stock screens as overvalued on this measure.
Result: OVERVALUED
P/E ratios tell one story, but what if the real opportunity lies elsewhere? Start investing in legacies, not executives. Discover our 21 top founder-led companies.
Upgrade Your Decision Making: Choose your DuPont de Nemours Narrative
Earlier it was mentioned that there is an even better way to understand valuation, so Narratives are introduced here as a simple tool that lets you attach a clear story about DuPont de Nemours, including your assumptions for future revenue, earnings and margins, to a financial forecast and a Fair Value that can be compared with the current share price to help you think about when to buy or sell.
On Simply Wall St’s Community page, Narratives are available as easy to use, shared scenarios that update automatically when fresh information such as news, guidance or earnings is added. This helps your Fair Value stay aligned with the latest data without extra work from you.
For DuPont de Nemours, for example, one investor might follow a more optimistic Narrative with a Fair Value around US$63.81 based on assumptions like 4.66% revenue growth, a 12.43% profit margin, a 30.94x future P/E and US$986.1m of earnings. Another investor might prefer a more cautious Narrative with a Fair Value closer to US$50.00 that uses 3.66% revenue growth, a 10.68% margin, a 29.10x future P/E and US$814.4m of earnings. Comparing these side by side can help you decide which story, and price, feels more realistic.
Do you think there's more to the story for DuPont de Nemours? Head over to our Community to see what others are saying!

This article by Simply Wall St is general in nature. We provide commentary based on historical data and analyst forecasts only using an unbiased methodology and our articles are not intended to be financial advice. It does not constitute a recommendation to buy or sell any stock, and does not take account of your objectives, or your financial situation. We aim to bring you long-term focused analysis driven by fundamental data. Note that our analysis may not factor in the latest price-sensitive company announcements or qualitative material. Simply Wall St has no position in any stocks mentioned.