Has The Market Gone Too Far With Poolcorp (POOL) After A 40% Share Price Slide?
Pool Corporation POOL | 0.00 |
- For investors considering whether Pool, at around US$180 per share, still reflects quality or whether the market has pushed it too far in one direction, this article examines what the current price might be implying about the stock's value.
- The stock has been under pressure, with the share price down 2.0% over the past week, 11.1% over the past month, 21.3% year to date, and 40.3% over the last year. This meaningfully shifts how many investors view its risk and return trade off.
- Recent coverage has focused on Pool as a leading pool supplies and equipment distributor during a period when consumer spending patterns and housing related activity are in focus for many investors. This context helps explain why sentiment has been sensitive and why the share price has reacted as it has over recent months.
- Across Simply Wall St's six core valuation checks, Pool scores a 3 out of 6 value score. This suggests the market may be pricing some aspects of the business more cautiously than others, and sets up a closer look at how different valuation methods, and an even richer way to think about valuation at the end of this article, line up against the current share price.
Approach 1: Pool Discounted Cash Flow (DCF) Analysis
A Discounted Cash Flow (DCF) model takes estimates of a company’s future cash flows and discounts them back to today using a required return, giving an estimate of what the entire business might be worth in today’s dollars.
For Pool, the 2 Stage Free Cash Flow to Equity model starts with last twelve months Free Cash Flow (FCF) of about $308.1 million. Analysts provide explicit forecasts for several years, and Simply Wall St extends those out further, with ten year FCF projections ranging from $353.6 million in 2026 to $564.1 million in 2035. For example, the model uses discounted FCF estimates such as $329.5 million for 2026 and $387.8 million for 2027, all in $ and all brought back to present value.
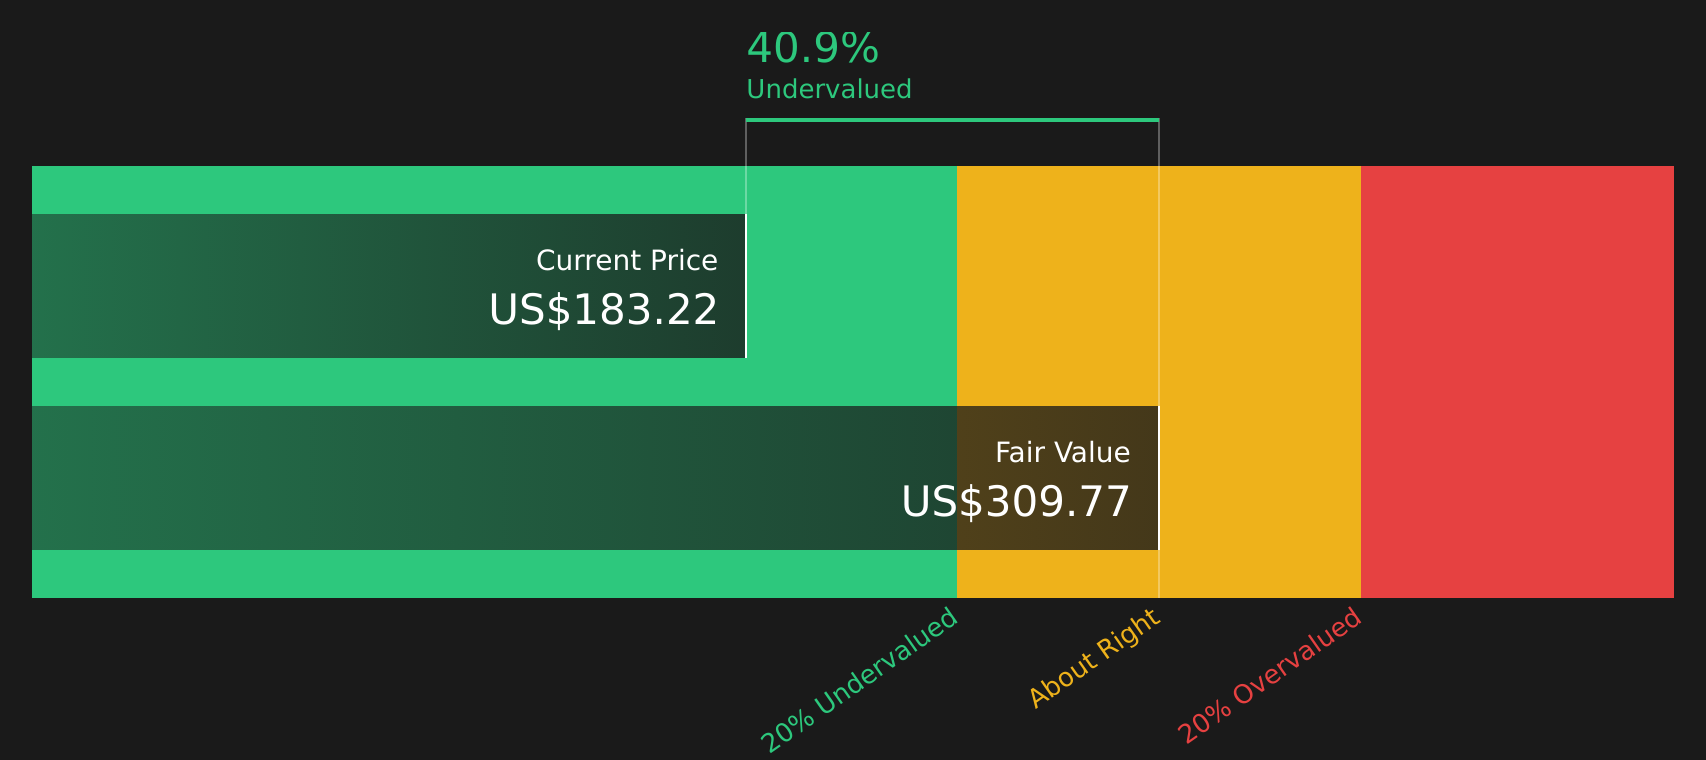
Adding these discounted cash flows and a terminal value gives an estimated intrinsic value of about $299.07 per share. Against a current share price around $180, the DCF output indicates Pool trades at roughly a 39.6% discount, which suggests the stock screens as undervalued on this cash flow view.
Result: UNDERVALUED
Our Discounted Cash Flow (DCF) analysis suggests Pool is undervalued by 39.6%. Track this in your watchlist or portfolio, or discover 47 more high quality undervalued stocks.
Approach 2: Pool Price vs Earnings
For a profitable company like Pool, the P/E ratio is a useful way to see how much you are paying for each dollar of earnings. In general, higher growth expectations or lower perceived risk can support a higher “normal” P/E, while slower growth or higher risk tend to justify a lower one.
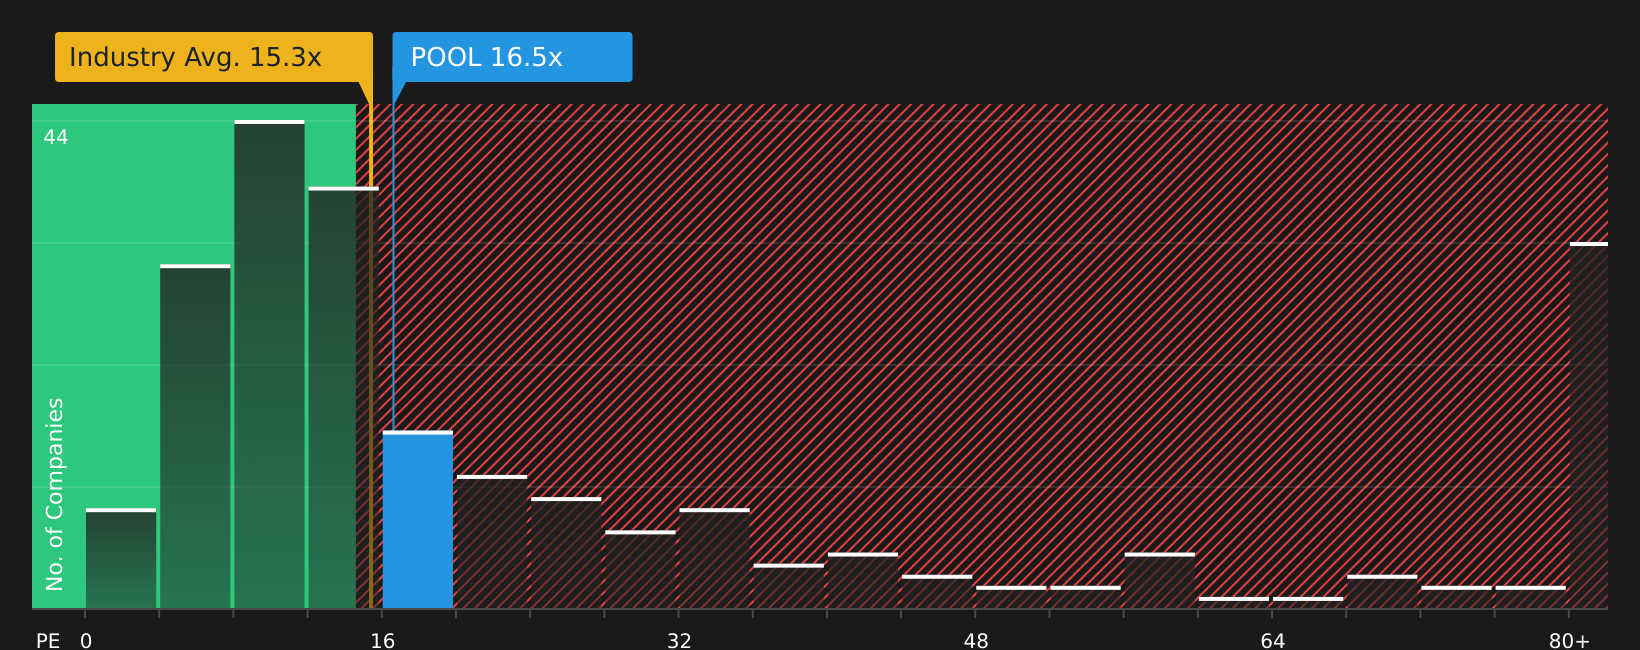
Pool currently trades on a P/E of 16.30x. That sits above the Retail Distributors industry average of about 15.63x and above the peer group average of 11.86x, which indicates the market is paying a higher price for Pool’s earnings than for many peers.
Simply Wall St’s Fair Ratio for Pool is 13.80x. This is a proprietary estimate of what Pool’s P/E might be, taking into account its earnings growth profile, industry, profit margins, market cap and risk factors. Because it draws on these company specific characteristics, the Fair Ratio can be more tailored than a simple comparison with peers or the broad industry.
Compared with today’s actual P/E of 16.30x, the Fair Ratio of 13.80x indicates that Pool’s earnings are priced at a premium that appears higher than what those fundamentals alone would indicate.
Result: OVERVALUED
Wall Street's queuing for one rocket. While SpaceX counts down to its IPO, other companies tied to the new space race are already in orbit. → 20 Compelling Space Companies watchlist · Global Space Race Investing Ideas screener · Scan the sector by valuation on Rocket Lab's valuation page.
Upgrade Your Decision Making: Choose your Pool Narrative
Earlier it was mentioned that there is an even better way to understand valuation. Narratives take the story you believe about Pool, including your assumptions for future revenue, earnings and margins, tie that story to a financial forecast on Simply Wall St’s Community page, translate it into a Fair Value that you can compare directly with today’s share price to decide whether the stock looks expensive or cheap on your view, and then keep that Fair Value updated as new news or earnings arrive. One investor might build a more optimistic Pool Narrative that lines up with a Fair Value around US$334.00, while another might lean on a more cautious Narrative closer to US$229.00, with each clearly seeing how their story, numbers and Fair Value fit together.
Do you think there's more to the story for Pool? Head over to our Community to see what others are saying!

This article by Simply Wall St is general in nature. We provide commentary based on historical data and analyst forecasts only using an unbiased methodology and our articles are not intended to be financial advice. It does not constitute a recommendation to buy or sell any stock, and does not take account of your objectives, or your financial situation. We aim to bring you long-term focused analysis driven by fundamental data. Note that our analysis may not factor in the latest price-sensitive company announcements or qualitative material. Simply Wall St has no position in any stocks mentioned.