Has The Recent Pullback In NXP Semiconductors (NXPI) Opened A Valuation Opportunity?
NXP Semiconductors NV NXPI | 194.55 | -0.53% |
- If you are wondering whether NXP Semiconductors' current share price lines up with its underlying worth, you are not alone. This article is built to help you judge that for yourself using clear valuation checks.
- The stock last closed at US$222.13, with a 4.9% decline over the past 7 days and a 9.7% decline over the past 30 days, while its year to date return is 0.4% and its 1 year return is 4.4%, compared with 23.8% over 3 years and 24.9% over 5 years.
- Recent attention on NXP Semiconductors has been driven by broader interest in semiconductor names and how investors are weighing long term demand for chips against shorter term share price swings. This backdrop gives extra context to the recent pullback and raises the question of whether the market is being too cautious or is appropriately pricing the risks.
- On our simple valuation checklist, NXP Semiconductors scores 4 out of 6, which suggests several metrics point to the shares looking potentially cheap. Next, we will walk through the usual valuation tools you might use, and then finish with a different way of thinking about value that can tie all these methods together.
Approach 1: NXP Semiconductors Discounted Cash Flow (DCF) Analysis
A Discounted Cash Flow model takes projected future cash flows, then discounts them back to today to estimate what the entire business could be worth right now.
For NXP Semiconductors, the starting point is last twelve month Free Cash Flow of about US$2.0b. Analysts have provided Free Cash Flow estimates out to 2030, with a projection of US$5.4b in that year. Beyond the explicit analyst window, Simply Wall St extrapolates further annual Free Cash Flow figures using a 2 Stage Free Cash Flow to Equity model.
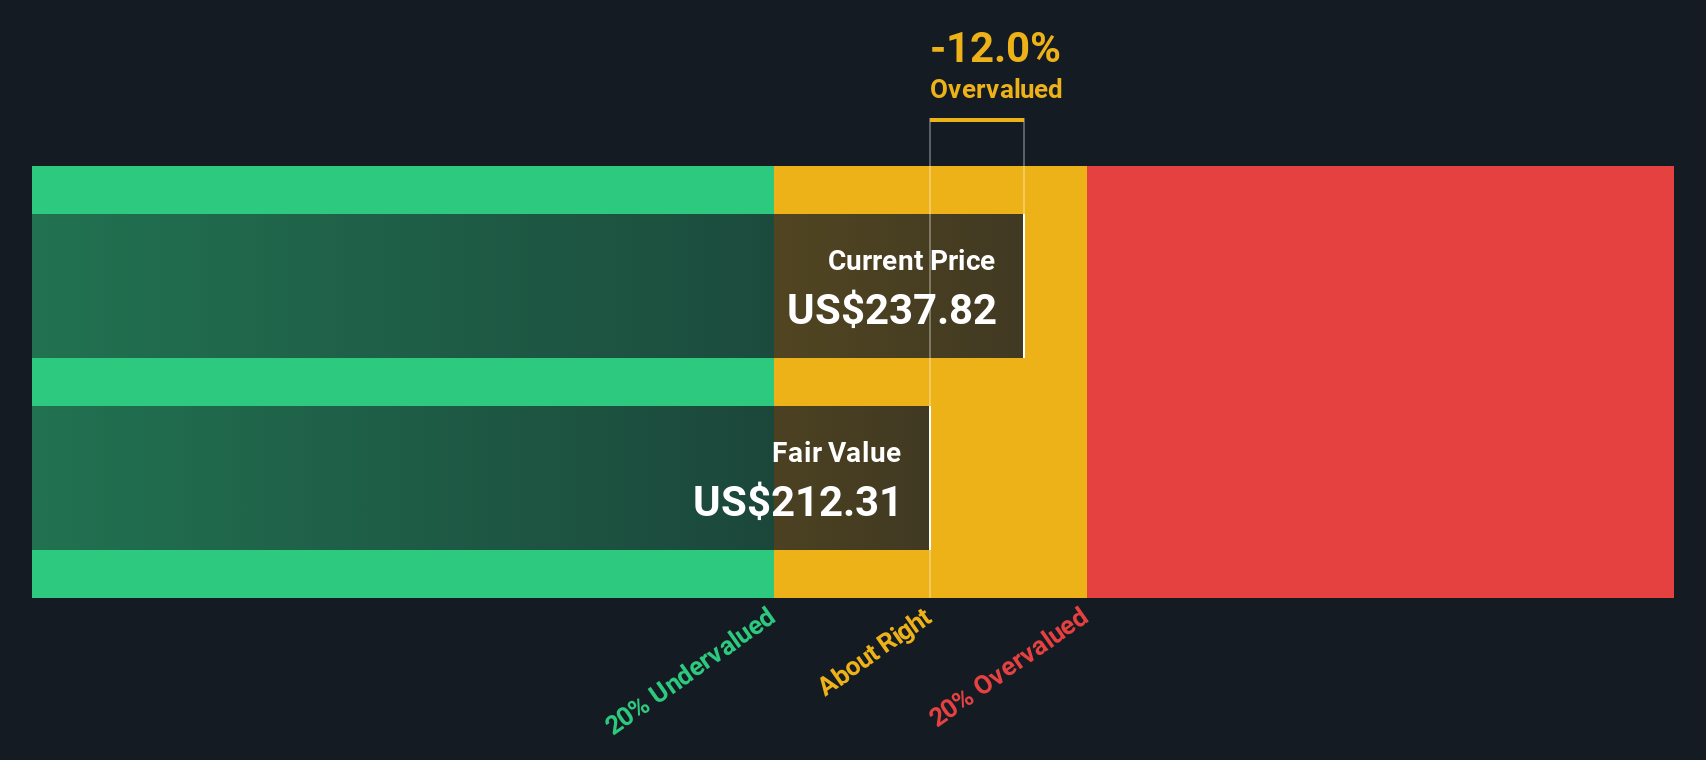
When all these projected cash flows are discounted back and combined, the model arrives at an estimated intrinsic value of about US$270.01 per share. Compared with the recent share price of US$222.13, this implies the stock trades at roughly a 17.7% discount to that DCF value, which indicates that the shares appear undervalued on this measure.
Result: UNDERVALUED
Our Discounted Cash Flow (DCF) analysis suggests NXP Semiconductors is undervalued by 17.7%. Track this in your watchlist or portfolio, or discover 55 more high quality undervalued stocks.
Approach 2: NXP Semiconductors Price vs Earnings
For profitable companies, the P/E ratio is a useful shortcut because it links what you pay directly to what the business is currently earning. It also captures how the market is weighing the balance between those earnings, future prospects and perceived risk.
What counts as a “normal” P/E depends on how fast earnings are expected to grow and how predictable those earnings look. Higher expected growth or lower perceived risk tend to justify higher P/E levels, while slower growth or higher uncertainty usually align with lower P/E ratios.
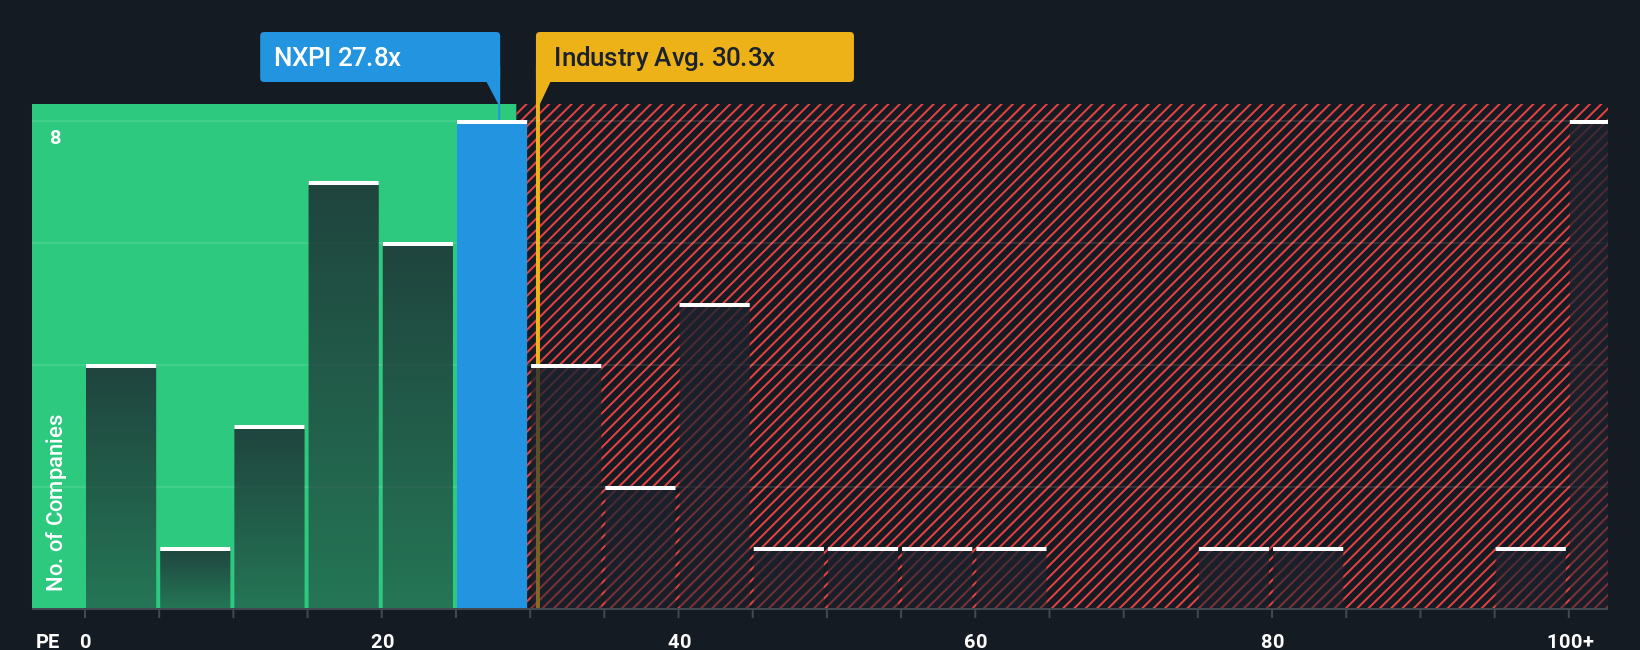
NXP Semiconductors currently trades on a P/E of 27.66x. That sits below the Semiconductor industry average P/E of 40.62x and also below the broader peer average of 70.51x. Simply Wall St’s Fair Ratio for NXP Semiconductors is 32.71x. This Fair Ratio is a proprietary estimate of what a reasonable P/E might be for the company given its earnings profile, industry, profit margins, size and risk characteristics.
Because the Fair Ratio blends these company specific inputs, it can give you a more tailored reference point than a simple comparison with peers or the industry. On this basis, NXP Semiconductors’ current P/E of 27.66x sits below the Fair Ratio of 32.71x, which indicates that the shares may be undervalued on this measure.
Result: UNDERVALUED
P/E ratios tell one story, but what if the real opportunity lies elsewhere? Start investing in legacies, not executives. Discover our 22 top founder-led companies.
Upgrade Your Decision Making: Choose your NXP Semiconductors Narrative
Earlier we mentioned that there is an even better way to understand valuation, so let us introduce you to Narratives.
A Narrative is simply your story about a company, written in numbers, where you set your own assumptions for future revenue, earnings, margins and a fair value that reflects how you see the business.
On Simply Wall St’s Community page, millions of investors use Narratives to connect a company’s story to a financial forecast and then to a fair value, so you can compare that Fair Value with the current share price and decide whether it looks like an opportunity or a warning sign.
Because Narratives update when new information such as earnings or news is added, your view of a company like NXP Semiconductors can shift quickly. One investor may see it as fairly valued with modest revenue growth and steady margins, while another assumes much stronger growth and higher long term margins, leading to a very different fair value.
Do you think there's more to the story for NXP Semiconductors? Head over to our Community to see what others are saying!

This article by Simply Wall St is general in nature. We provide commentary based on historical data and analyst forecasts only using an unbiased methodology and our articles are not intended to be financial advice. It does not constitute a recommendation to buy or sell any stock, and does not take account of your objectives, or your financial situation. We aim to bring you long-term focused analysis driven by fundamental data. Note that our analysis may not factor in the latest price-sensitive company announcements or qualitative material. Simply Wall St has no position in any stocks mentioned.