Has The Steep Slide In BILL Holdings (BILL) Opened A Fresh Valuation Opportunity?
BILL Holdings BILL | 37.00 37.00 | +0.65% 0.00% Post |
- If you are wondering whether BILL Holdings at around US$35.68 is starting to look like value or still a value trap, you are not alone.
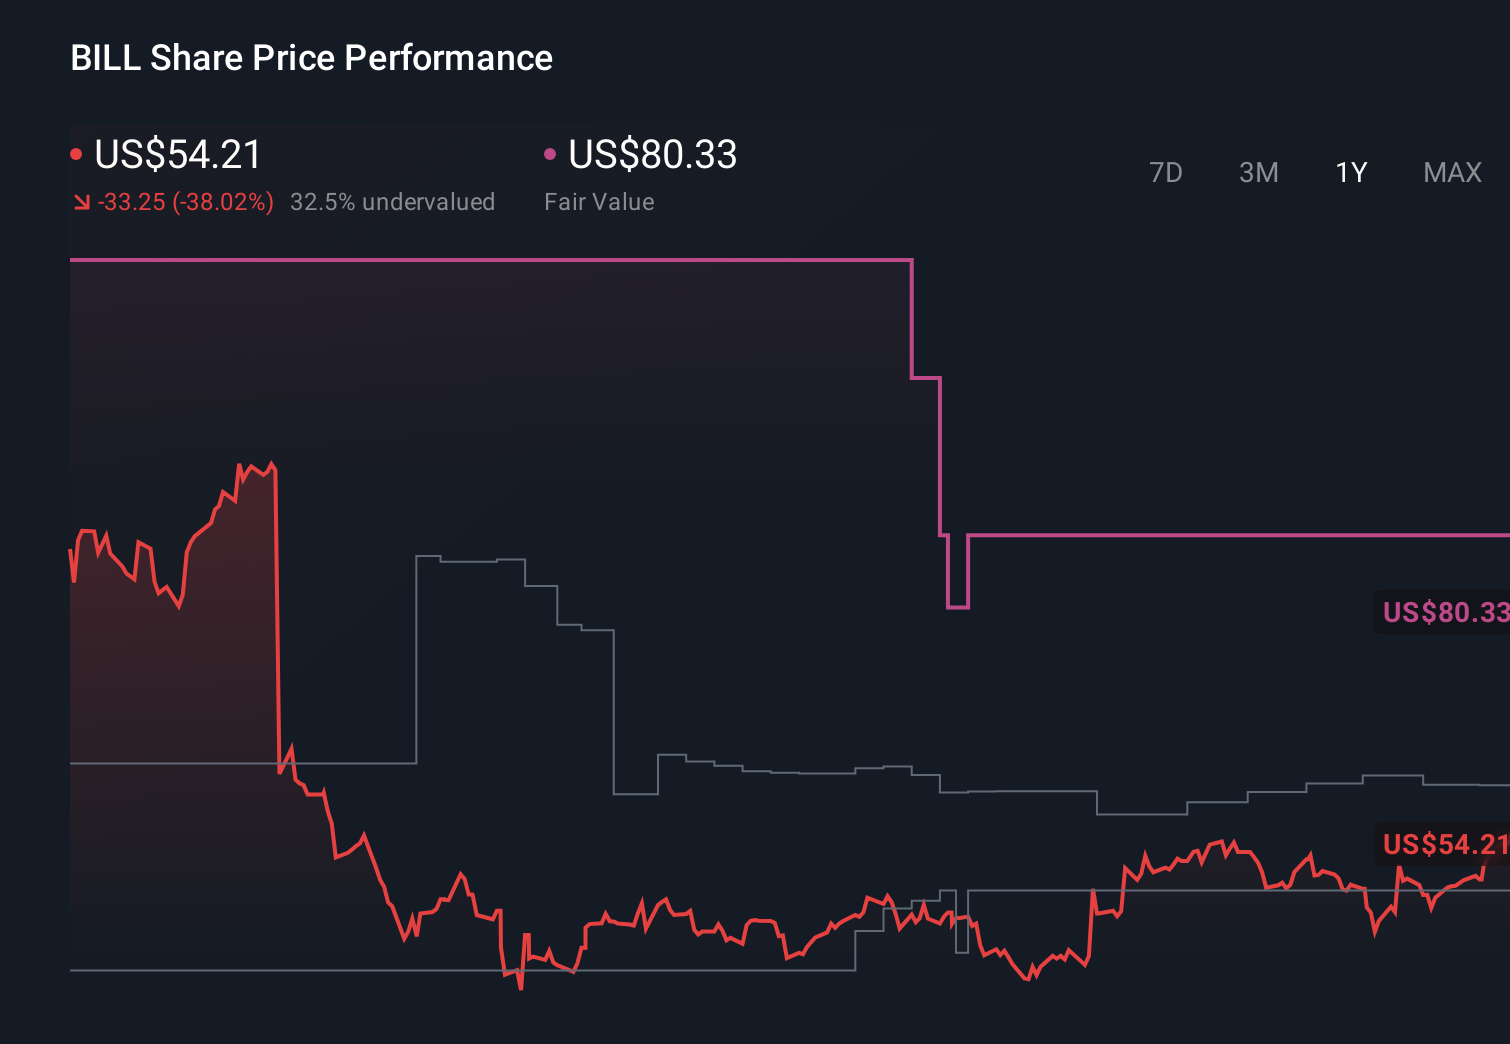
- The share price has seen steep declines recently, with returns of 17.8% over 7 days, 35.5% over 30 days, 29.4% year to date, 63.0% over 1 year, 63.5% over 3 years and 80.8% over 5 years.
- These moves have put BILL firmly back on many investors' watchlists, as they reassess what a reasonable price might be for the shares. The recent share price history provides a useful backdrop for thinking about what the business could be worth using several different valuation tools.
- On our framework of 6 valuation checks, BILL Holdings currently scores a 5 out of 6. This suggests it screens as undervalued on most but not all measures. We will look at what each approach is telling you, then finish with a way of thinking about valuation that can bring the whole picture together.
Approach 1: BILL Holdings Discounted Cash Flow (DCF) Analysis
A Discounted Cash Flow, or DCF, model estimates what a company could be worth by projecting its future cash flows and discounting them back to today using a required return. It is essentially asking what those future dollars are worth in present terms.
For BILL Holdings, the model used is a 2 Stage Free Cash Flow to Equity approach, based on cash flows in US$. The latest twelve month free cash flow is about $320.6 million. Analyst inputs and extrapolated estimates suggest free cash flow of $320.4 million in 2026, rising in the model to $834.8 million in 2035, with interim projections along the way provided by analysts for earlier years and then extended by Simply Wall St.
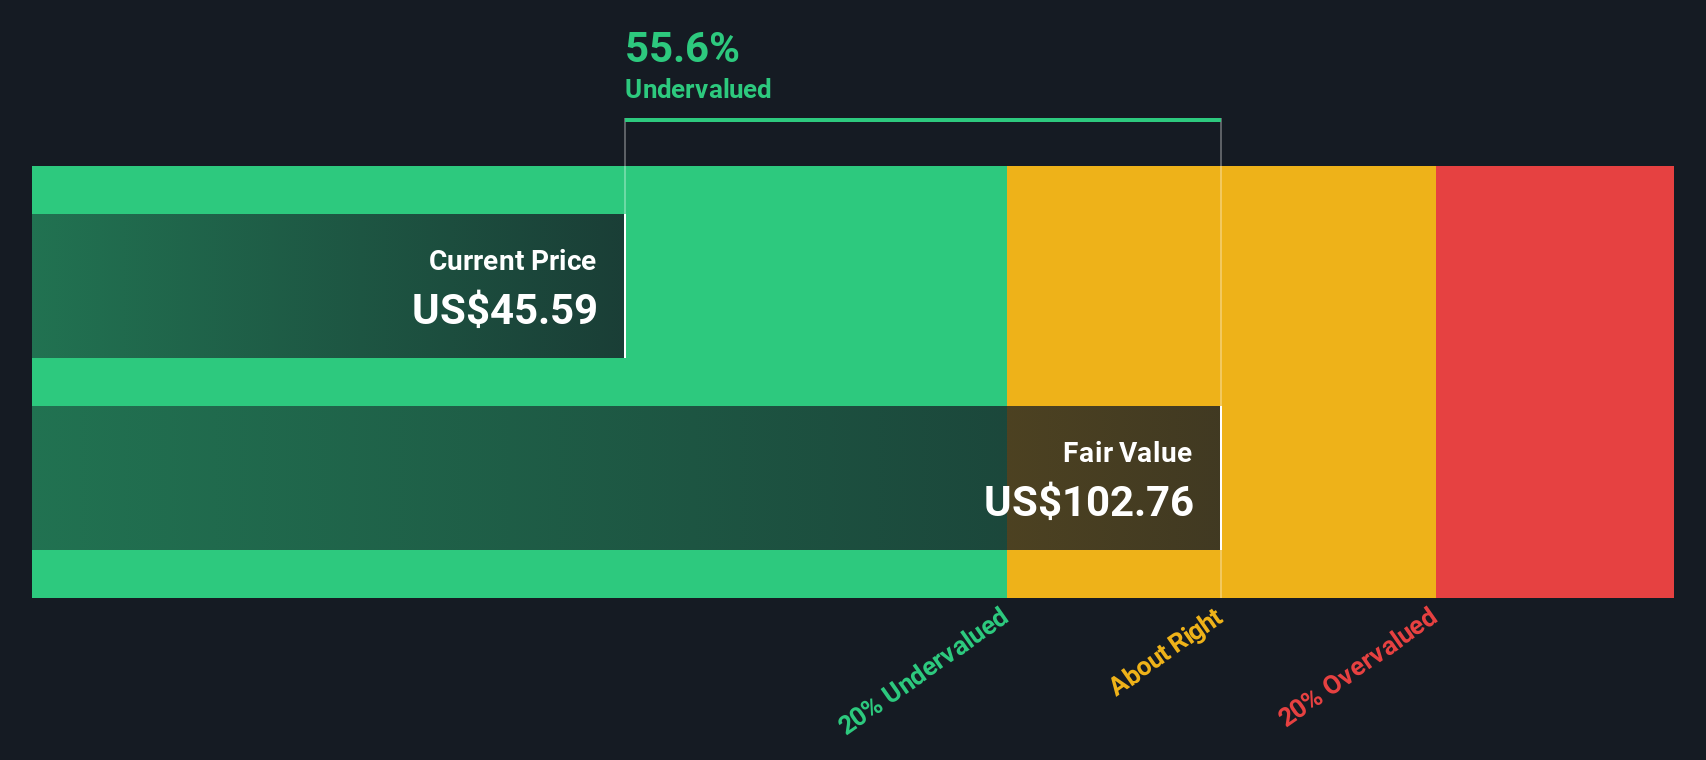
When all of those projected cash flows are discounted back, the DCF estimate of intrinsic value comes out at about $88.90 per share. Compared with the recent share price of around $35.68, this implies a discount of roughly 59.9%, which indicates that BILL screens as significantly undervalued on this measure alone.
Result: UNDERVALUED
Our Discounted Cash Flow (DCF) analysis suggests BILL Holdings is undervalued by 59.9%. Track this in your watchlist or portfolio, or discover 55 more high quality undervalued stocks.
Approach 2: BILL Holdings Price vs Sales
For companies where earnings can be less consistent, the P/S ratio is often a useful cross check because it focuses on revenue, which is usually more stable than profit. Investors typically expect faster growing or lower risk businesses to trade on a higher P/S multiple, while slower growth or higher risk names tend to justify a lower one.
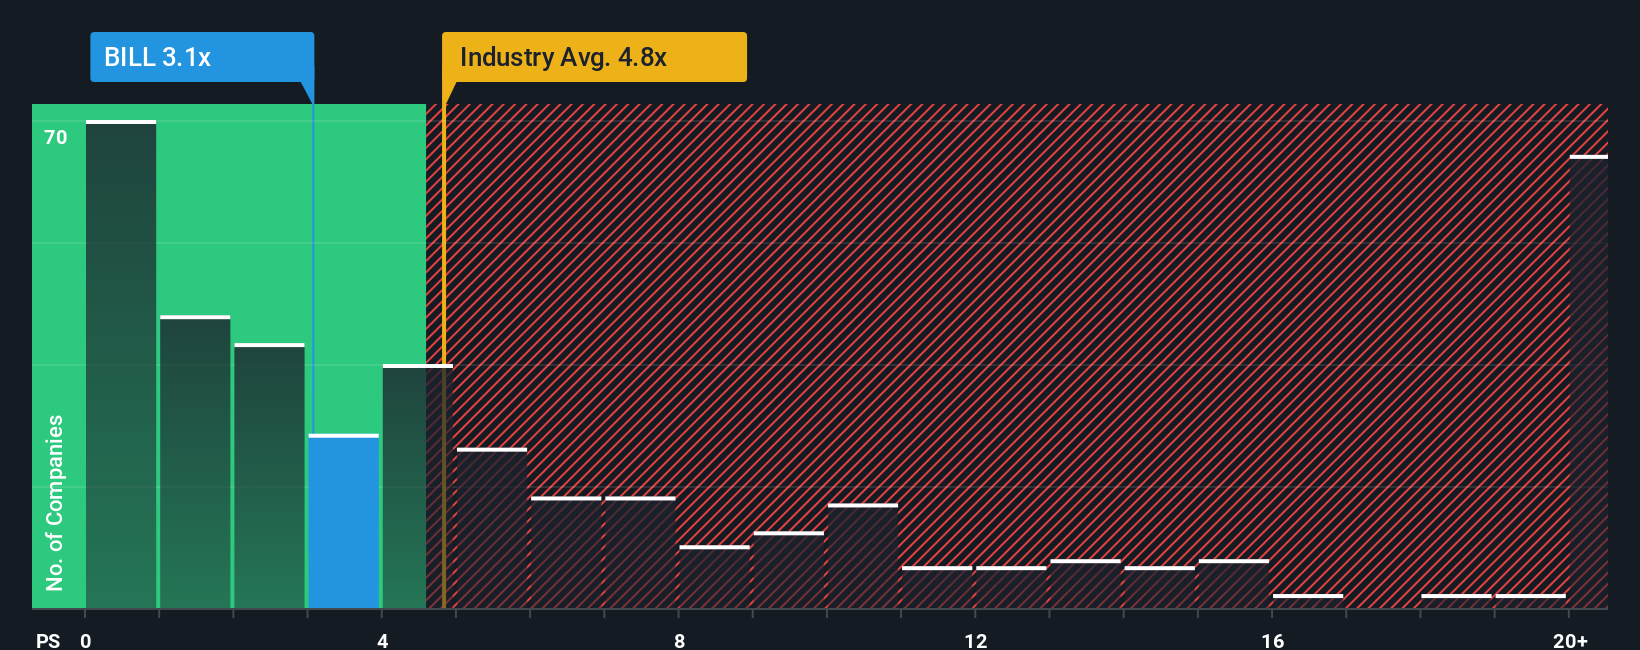
BILL Holdings currently trades on a P/S of about 2.38x. That sits below both the Software industry average of around 3.71x and the selected peer group average of about 4.69x, so on simple comparisons the shares look inexpensive relative to revenue.
Simply Wall St’s Fair Ratio for BILL, at 5.73x, is an estimate of what the P/S could be given factors such as earnings growth, industry, profit margins, market cap and specific risks. Because it is tailored to the company rather than being a blunt comparison to peers, it can provide a more rounded view than just lining up P/S against the sector.
With the current P/S of 2.38x sitting below the Fair Ratio of 5.73x, this framework suggests BILL screens as undervalued on a sales multiple basis.
Result: UNDERVALUED
P/S ratios tell one story, but what if the real opportunity lies elsewhere? Start investing in legacies, not executives. Discover our 22 top founder-led companies.
Upgrade Your Decision Making: Choose your BILL Holdings Narrative
Earlier we mentioned that there is an even better way to understand what BILL Holdings might be worth, so let us introduce you to Narratives.
A Narrative is simply your story for the company, where you spell out how you think its revenue, earnings and margins could play out, and then connect that story to an estimated fair value.
On Simply Wall St, available to millions of investors on the Community page, Narratives turn this story into a structured forecast and a fair value estimate, then line that up against the current share price so you can see whether your view suggests the stock is expensive or inexpensive.
Because Narratives update automatically when new information such as news or earnings is added to the platform, your fair value view can stay aligned with what is happening without you rebuilding a model from scratch every time.
For BILL Holdings, one investor might see a very conservative future and set a low fair value, while another expects stronger fundamentals and sets a much higher fair value. Narratives simply make those different viewpoints clear and comparable against the current price.
Do you think there's more to the story for BILL Holdings? Head over to our Community to see what others are saying!
This article by Simply Wall St is general in nature. We provide commentary based on historical data and analyst forecasts only using an unbiased methodology and our articles are not intended to be financial advice. It does not constitute a recommendation to buy or sell any stock, and does not take account of your objectives, or your financial situation. We aim to bring you long-term focused analysis driven by fundamental data. Note that our analysis may not factor in the latest price-sensitive company announcements or qualitative material. Simply Wall St has no position in any stocks mentioned.