Has Vistance Networks (VISN) Pullback Opened A Fresh Opportunity For Investors?
Gyroscope Therapeutics Holdings plc VISN | 0.00 |
- If you are wondering whether Vistance Networks at US$11.93 is still priced attractively after a big run, the current setup gives you a lot to weigh up before making any moves.
- The stock has pulled back sharply in the short term, with a 38.5% decline over 7 days and a 36.3% decline over 30 days, even after very strong 413.6% 1 year and 411.5% 3 year returns.
- These swings have brought the stock back into focus for valuation minded investors who are weighing up whether the recent weakness is a reset of expectations or simply a pause after rapid gains. With no single headline event driving the move, it makes sense to look past day to day sentiment and focus on what the underlying valuation actually says.
- On Simply Wall St's 6 point valuation checklist, Vistance Networks scores 5, as shown by its 5 out of 6 valuation score. Next, you will see how different valuation methods line up on the stock and why there may be an even more useful way to frame value at the end of this article.
Approach 1: Vistance Networks Discounted Cash Flow (DCF) Analysis
A Discounted Cash Flow, or DCF, model estimates what a business could be worth today by projecting its future cash flows and then discounting those back to a single present value figure.
For Vistance Networks, the model used is a 2 Stage Free Cash Flow to Equity approach, based on cash flows in US$. The latest twelve month free cash flow is reported at about $254.8 million. Analysts provide explicit forecasts out to 2027, with free cash flow for that year of $219 million. Simply Wall St then extends the view with further projections out to 2035 using its own assumptions.
Across these ten year projections, discounted cash flows for years such as 2026 and 2027 are $119.3 million and $187.2 million respectively. Later years also contribute meaningfully to the total valuation. Bringing all those projected and discounted cash flows together, the model arrives at an estimated intrinsic value of US$17.29 per share.
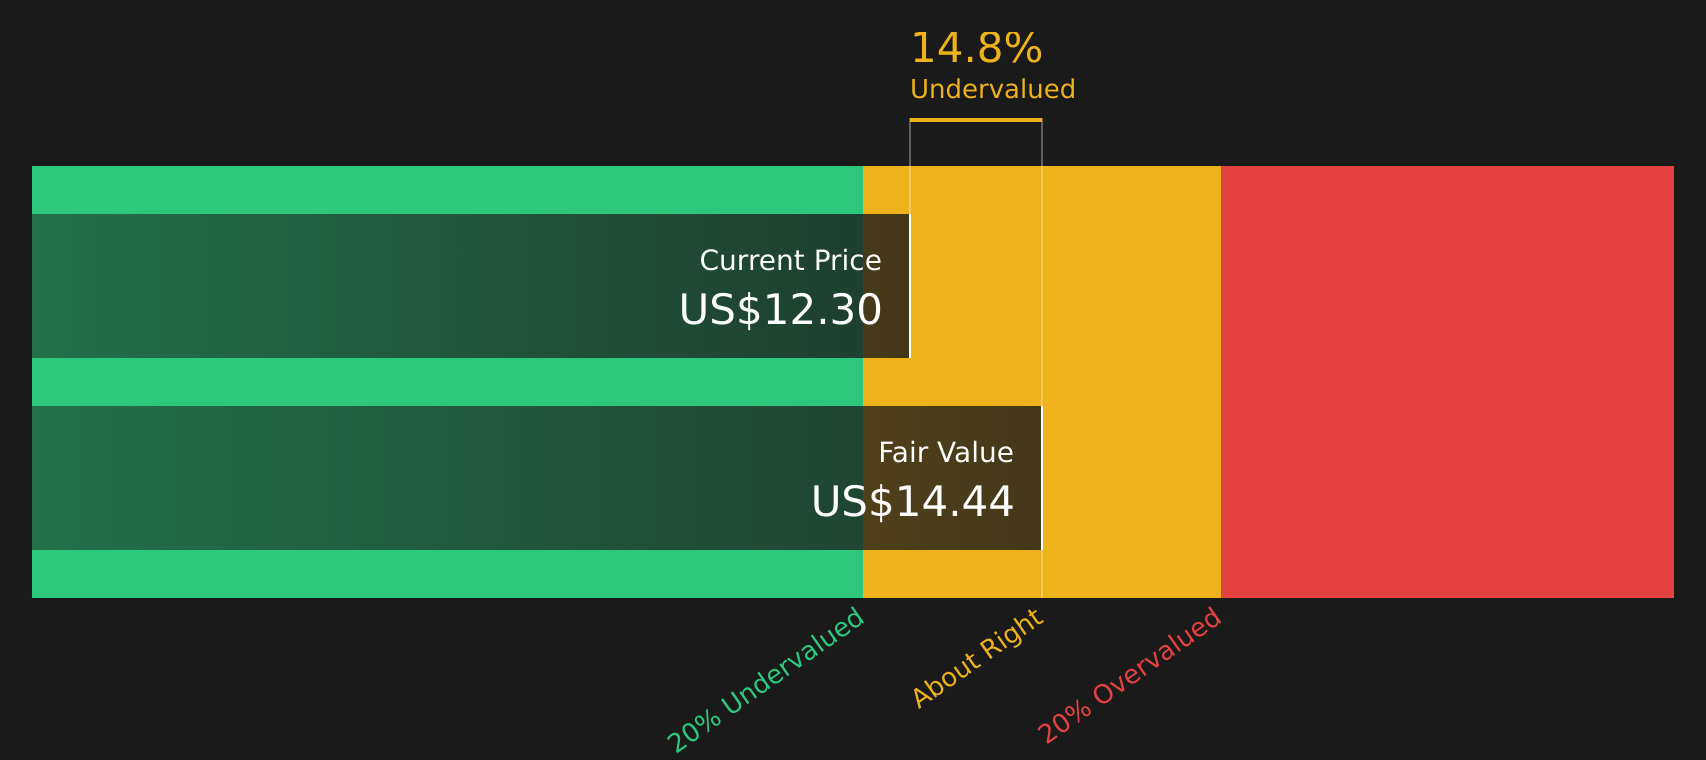
Compared with the current share price of US$11.93, this estimate suggests a 31.0% discount, indicating that Vistance Networks is trading materially below this DCF estimate.
Result: UNDERVALUED
Our Discounted Cash Flow (DCF) analysis suggests Vistance Networks is undervalued by 31.0%. Track this in your watchlist or portfolio, or discover 50 more high quality undervalued stocks.
Approach 2: Vistance Networks Price vs Earnings
For profitable businesses, the P/E ratio is a useful shorthand because it links what you pay per share to the company’s current earnings. It lets you see how many dollars investors are willing to pay for each dollar of profit.
What counts as a “normal” P/E depends on how the market views a company’s growth potential and risk. Higher expected growth or lower perceived risk can justify a higher multiple, while slower growth or higher risk usually supports a lower one.
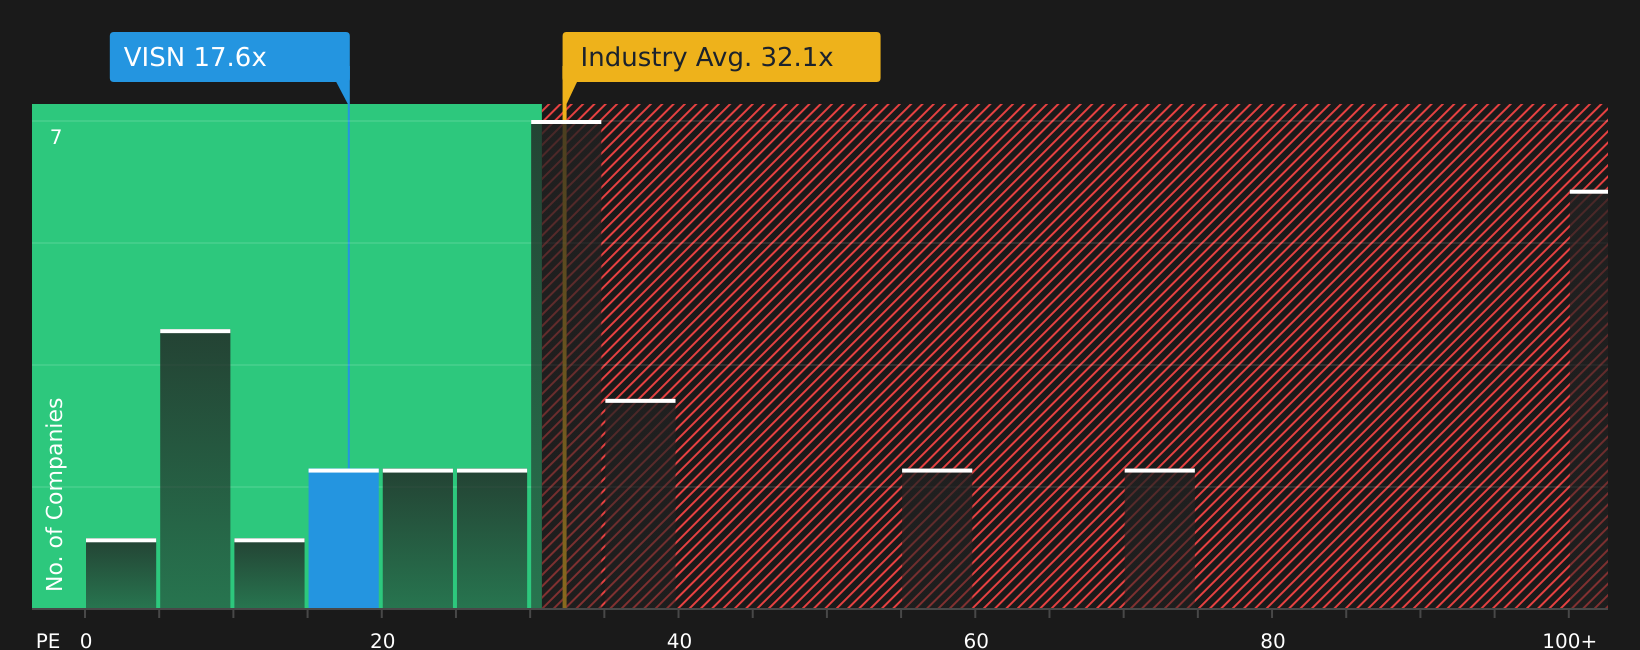
Vistance Networks currently trades on a P/E of 16.69x. This sits well below the Communications industry average of 35.42x and the reported peer average of 85.00x. On simple comparisons, the stock trades at a lower earnings multiple than both its sector and peers.
Simply Wall St also uses a proprietary “Fair Ratio”, which is the P/E it would expect for Vistance Networks after factoring in elements such as earnings growth, profit margins, market cap, industry characteristics and company specific risks. This tends to be more tailored than a basic industry or peer comparison because it adjusts for the company’s own profile rather than assuming all Communications stocks deserve similar multiples.
In this case, the Fair Ratio is not available, so it is not possible to state whether the current 16.69x P/E looks overvalued, undervalued or about right on this framework.
Result: ABOUT RIGHT
P/E ratios tell one story, but what if the real opportunity lies elsewhere? Start investing in legacies, not executives. Discover our 17 top founder-led companies.
Upgrade Your Decision Making: Choose your Vistance Networks Narrative
Earlier it was mentioned that there is an even better way to understand valuation. Narratives are introduced here as short, plain language stories that link your view of Vistance Networks future revenue, earnings and margins to a financial forecast, a Fair Value and then a simple Fair Value versus Price comparison on Simply Wall St's Community page. For example, one investor might build a bullish Vistance Networks Narrative around a Fair Value of US$25.00, while a more cautious investor works with US$20.00. Both Narratives then automatically refresh when new news or earnings are added so you can see whether your story still justifies your numbers before deciding whether the current share price of US$11.93 looks attractive or stretched.
Do you think there's more to the story for Vistance Networks? Head over to our Community to see what others are saying!

This article by Simply Wall St is general in nature. We provide commentary based on historical data and analyst forecasts only using an unbiased methodology and our articles are not intended to be financial advice. It does not constitute a recommendation to buy or sell any stock, and does not take account of your objectives, or your financial situation. We aim to bring you long-term focused analysis driven by fundamental data. Note that our analysis may not factor in the latest price-sensitive company announcements or qualitative material. Simply Wall St has no position in any stocks mentioned.