HeartFlow (HTFL): Assessing a Rich Valuation After the Latest Share Price Rebound
HeartFlow, Inc. HTFL | 24.83 | +1.35% |
HeartFlow (HTFL) has climbed about 9% in a day and 8% over the past week, an eye catching move for a relatively young medtech stock. Investors are asking whether this momentum is sustainable.
The latest surge comes after a choppy few months, with a 30 day share price return of 5.21% but a 90 day share price return still in negative territory, suggesting momentum is only just starting to rebuild.
If HeartFlow's recent move has your attention, it could be a good moment to explore other innovative names across healthcare stocks that might be setting up for similar shifts.
With shares still trading at a sizeable discount to analyst targets despite rapid revenue growth and ongoing losses, the key question now is whether HeartFlow is an underappreciated growth story or if the market already anticipates its next leg higher.
Price to Sales of 15.1x: Is it justified?
HeartFlow's latest close at 28.65 dollars equates to a rich price to sales multiple, especially when stacked against peers in the Healthcare Services space.
The price to sales ratio compares the company’s market value to its revenue, a useful lens for early stage, loss making medtech names where earnings are still negative. In HeartFlow’s case, investors are effectively paying a high premium for each dollar of current sales, which reflects strong confidence in future commercial scaling and adoption of its AI driven cardiac imaging platform despite ongoing losses.
That premium becomes more striking when set beside benchmarks. HeartFlow is on 15.1 times sales versus roughly 2 to 3 times for both the wider US Healthcare Services industry and close peers. This places the stock in the upper valuation tier and indicates that the market is assigning a valuation well above current fundamentals.
Result: Price to Sales of 15.1x (OVERVALUED)
However, lingering losses and any slowdown in its nearly 20 percent annual revenue growth could quickly challenge the premium multiple investors are paying.
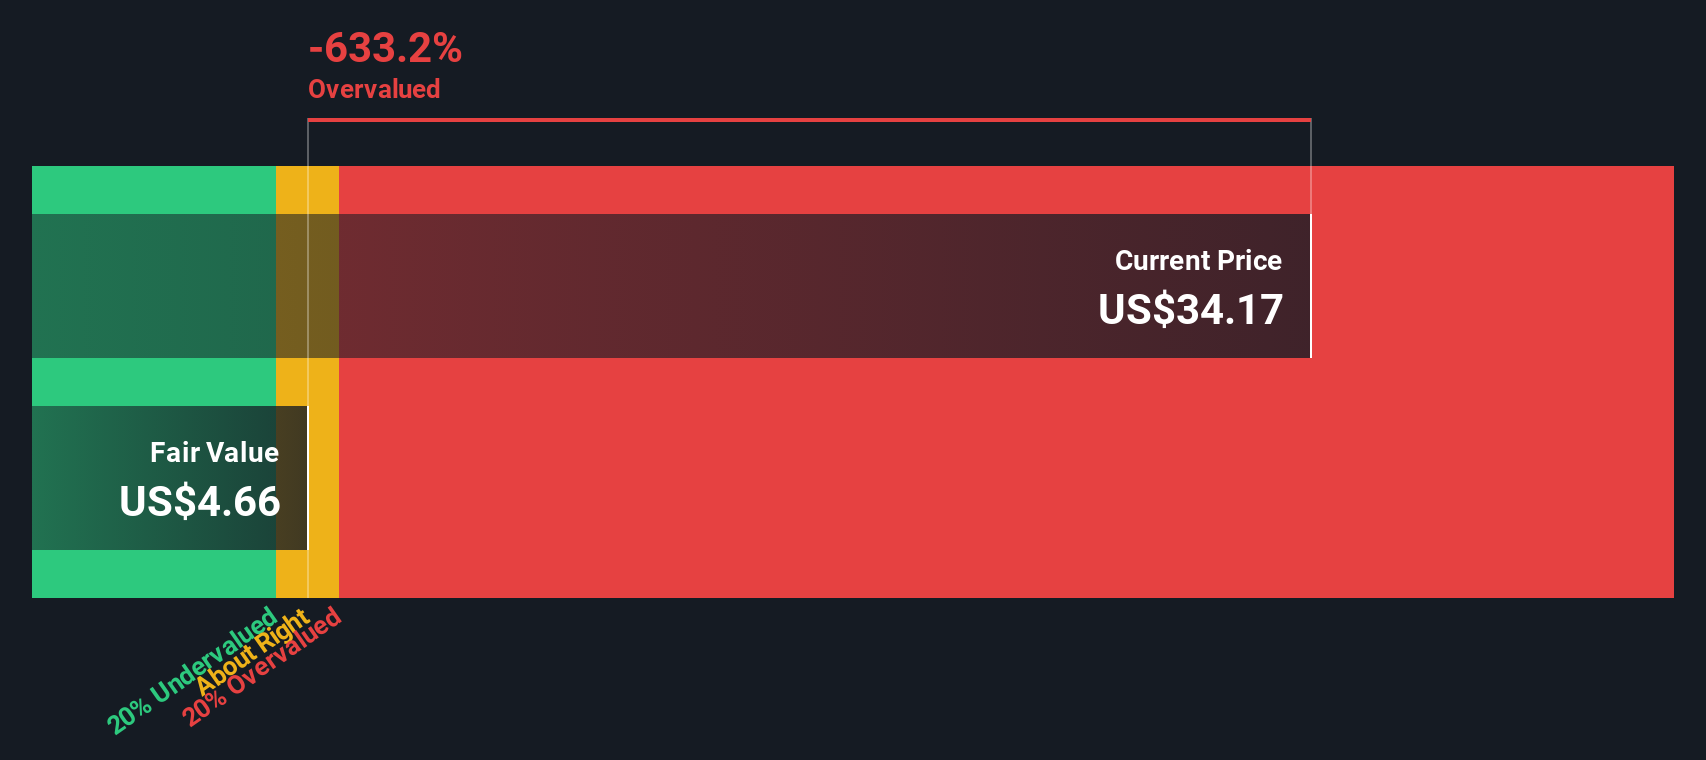
Another View: Our DCF Model Paints an Even Harsher Picture
While the current 15.1 times sales multiple already looks demanding, our DCF model goes further and suggests HeartFlow is trading well above its estimated fair value of 4.69 dollars, which implies material downside if growth or margins fall short of the optimistic narrative.
Simply Wall St performs a discounted cash flow (DCF) on every stock in the world every day (check out HeartFlow for example). We show the entire calculation in full. You can track the result in your watchlist or portfolio and be alerted when this changes, or use our stock screener to discover 919 undervalued stocks based on their cash flows. If you save a screener we even alert you when new companies match - so you never miss a potential opportunity.
Build Your Own HeartFlow Narrative
If you see the numbers differently or want to dig into the data yourself, you can build a personalized view in just a few minutes: Do it your way.
A great starting point for your HeartFlow research is our analysis highlighting 3 key rewards and 2 important warning signs that could impact your investment decision.
Looking for more investment ideas?
Do not stop at one promising name. Put Simply Wall Street’s screener to work so you can uncover the next opportunities before everyone else notices.
- Capture potential multibaggers early by scanning these 3608 penny stocks with strong financials that combine market mispricing with healthier fundamentals than typical speculative names.
- Ride structural tailwinds in automation and data by targeting these 24 AI penny stocks positioned at the center of the AI transformation.
- Lock in quality at a discount by focusing on these 13 dividend stocks with yields > 3% that pay you to wait while valuations catch up.
This article by Simply Wall St is general in nature. We provide commentary based on historical data and analyst forecasts only using an unbiased methodology and our articles are not intended to be financial advice. It does not constitute a recommendation to buy or sell any stock, and does not take account of your objectives, or your financial situation. We aim to bring you long-term focused analysis driven by fundamental data. Note that our analysis may not factor in the latest price-sensitive company announcements or qualitative material. Simply Wall St has no position in any stocks mentioned.