Helix Energy Solutions Group (HLX) Stock Could Be 30.5% Undervalued Despite Recent Pullback
Helix Energy Solutions Group, Inc. HLX | 0.00 |
Helix Energy Solutions Group (HLX) is back on investors’ radar after recent share price pressure, with the stock down over the past week, month, and past 3 months despite positive annual revenue and net income growth.
At a share price of $8.69, Helix Energy Solutions Group has pulled back sharply in the short term, with the 7 day share price return down 11.05% and the 30 day share price return down 14.97%. However, the year to date share price return of 35.78% and 1 year total shareholder return of 23.61% show that longer term momentum has not fully reversed.
If recent volatility in Helix Energy Solutions Group has you reassessing your watchlist, this can be a useful moment to look across the energy space and check out 34 power grid technology and infrastructure stocks
So with Helix Energy Solutions Group trading at $8.69, alongside positive annual revenue and net income growth and a sizeable discount to some intrinsic and analyst estimates, is this a genuine value opportunity, or is the market already pricing in future growth?
Most Popular Narrative: 30.5% Undervalued
Compared with the most followed fair value estimate of $12.50, Helix Energy Solutions Group at $8.69 sits at a steep narrative discount that hinges on how its offshore contracts and merger path play out.
The pronounced long term uptick in global demand for well abandonment, decommissioning, and offshore maintenance (as more aging fields require regulatory compliant retirement) will expand Helix's core addressable market, supporting durable revenue growth, backlog expansion, and reduced earnings volatility.
Curious what underpins that $12.50 fair value for Helix Energy Solutions Group? The narrative leans heavily on a profit margin reset, faster earnings, and a future earnings multiple that must compress yet still stay elevated. The full breakdown spells out exactly how those moving parts combine into today’s valuation gap.
Result: Fair Value of $12.50 (UNDERVALUED)
However, Helix Energy Solutions Group still faces real pressure from project deferrals, spot market exposure, and higher operating costs that could undermine the optimistic valuation narrative.
Another View: What Helix Energy Solutions Group’s P/E Is Saying
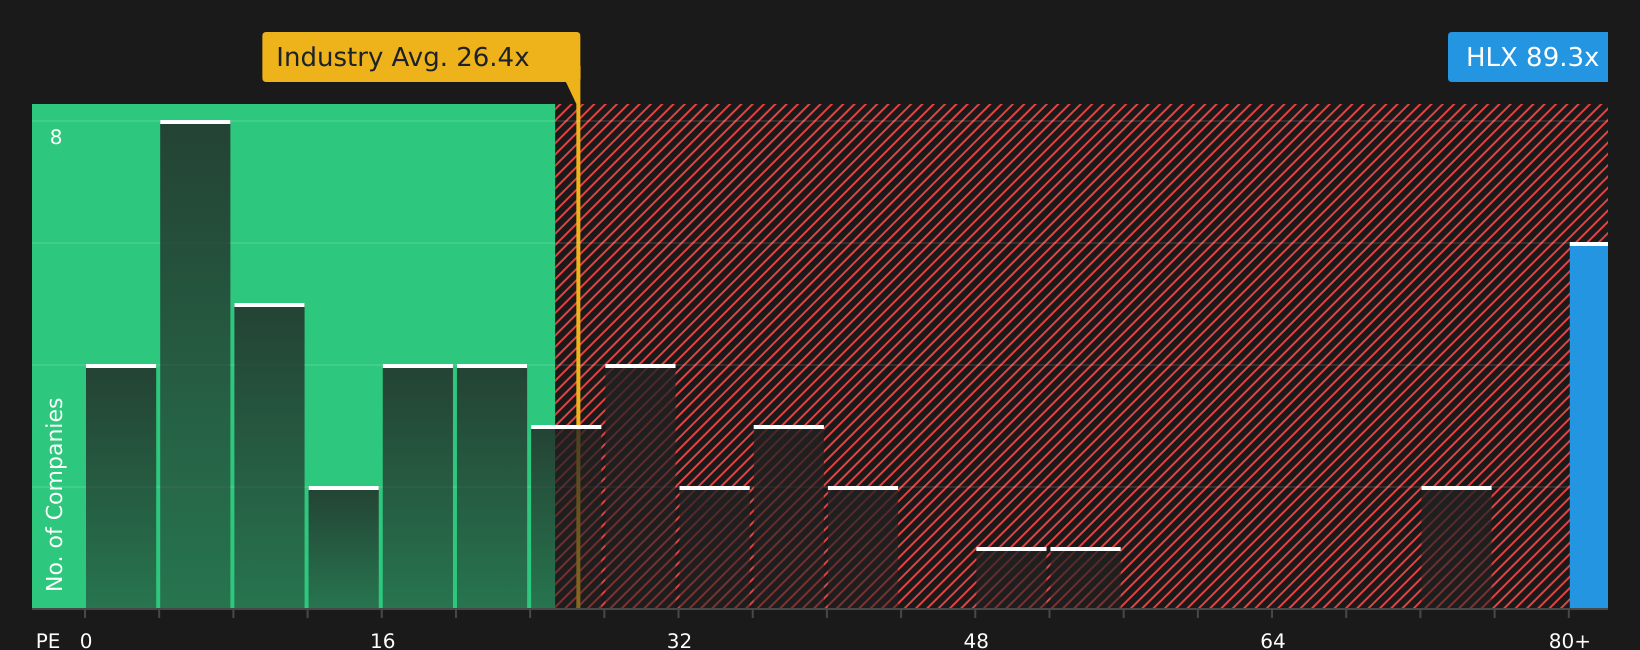
While Helix Energy Solutions Group screens as undervalued against the $12.50 fair value narrative, its current P/E of 89.3x is much higher than the US Energy Services industry at 27.1x, the peer average at 72.5x, and the fair ratio of 17.6x. This points to meaningful valuation risk if sentiment shifts.
With such a wide gap between today’s P/E and that fair ratio the market could move towards, investors need to ask whether the story justifies paying this kind of premium, or if expectations have simply run too far ahead of the numbers.
Next Steps
Given the mixed sentiment around Helix Energy Solutions Group, it makes sense to move fast, review the underlying data, and weigh both sides of the story. To see a concise breakdown of the balance between optimism and concern, including the company’s key positives and the issues investors are watching, check out the 2 key rewards and 2 important warning signs
Looking for more investment ideas beyond Helix Energy Solutions Group?
If the current setup around Helix Energy Solutions Group has sharpened your focus, do not stop there. Use this moment to broaden your opportunity set with targeted screeners.
- Spot potential upside early by scanning screener containing 20 high quality undiscovered gems that combine strong fundamentals with limited market attention.
- Prioritize resilience by reviewing 66 resilient stocks with low risk scores that score well on stability and downside protection.
- Strengthen your core holdings by assessing companies in the solid balance sheet and fundamentals stocks screener (48 results) to see which businesses pair quality balance sheets with solid fundamentals.
This article by Simply Wall St is general in nature. We provide commentary based on historical data and analyst forecasts only using an unbiased methodology and our articles are not intended to be financial advice. It does not constitute a recommendation to buy or sell any stock, and does not take account of your objectives, or your financial situation. We aim to bring you long-term focused analysis driven by fundamental data. Note that our analysis may not factor in the latest price-sensitive company announcements or qualitative material. Simply Wall St has no position in any stocks mentioned.