Helix Energy Solutions Group (HLX) Valuation After Record Q4 Revenue And New Multiyear Contract Wins
Helix Energy Solutions Group, Inc. HLX | 9.76 | +1.61% |
Helix Energy Solutions Group (HLX) is back in focus after reporting its highest fourth quarter revenue since 2013, positive free cash flow, and year end cash and liquidity that support recently secured multiyear contracts.
Those results come after a busy period, with Helix Energy Solutions Group reporting full year 2025 earnings, recording a US$18.06 million long lived asset impairment, completing its share repurchase program, and preparing to present at the THRIVE Energy Conference in Houston. The share price has reacted strongly, with a 30 day share price return of 21.56% and a 90 day share price return of 37.99% helping push the stock to US$9.19. The 1 year total shareholder return of 6.61% and 5 year total shareholder return of 57.09% point to momentum that has been building over a longer horizon.
If this offshore energy update has you looking for other opportunities, our screener of 23 power grid technology and infrastructure stocks is a handy way to spot companies linked to critical energy infrastructure.
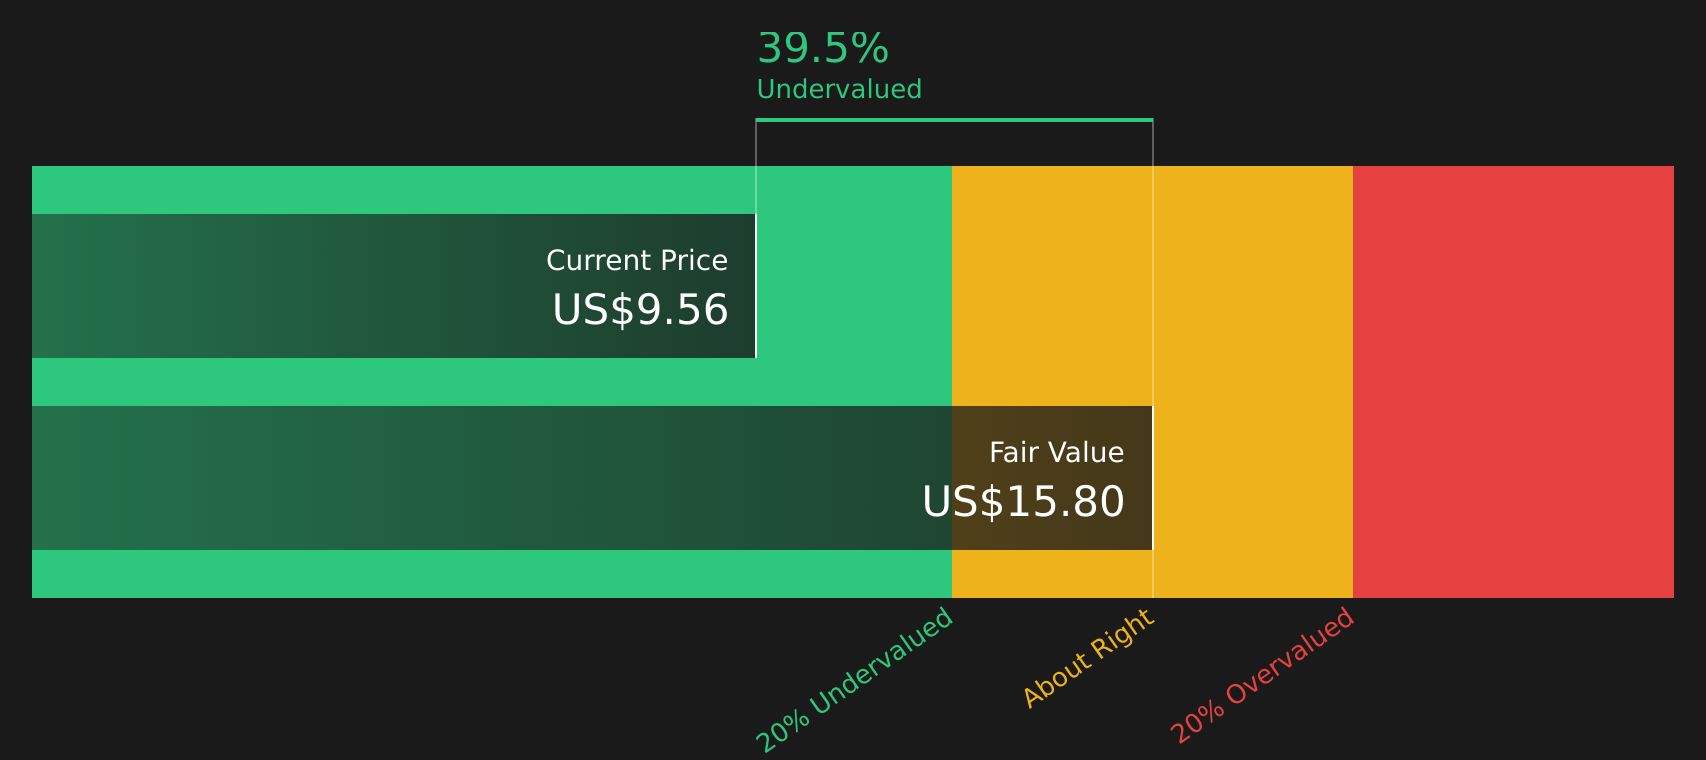
With Helix trading at US$9.19, sitting at a 25% discount to analyst price targets and an indicated 41% discount to intrinsic value, you have to ask yourself: is there still a buying opportunity here, or is the market already pricing in future growth?
Most Popular Narrative: 5.7% Undervalued
Helix Energy Solutions Group's fair value in the most followed narrative sits at $9.75, just above the last close at $9.19. This keeps the focus firmly on what is driving that gap.
The pronounced long-term uptick in global demand for well abandonment, decommissioning, and offshore maintenance (as more aging fields require regulatory-compliant retirement) will expand Helix's core addressable market, supporting durable revenue growth, backlog expansion, and reduced earnings volatility.
Curious how that projected demand, tighter margins, and future earnings expectations all feed into a $9.75 fair value and an undervalued DCF outcome? The most followed narrative leans on a detailed path for revenue, profitability, and share count that is anything but simple.
Result: Fair Value of $9.75 (UNDERVALUED)
However, you also need to weigh up the risk that project deferrals and weaker spot markets could cap utilization, margins, and the cash returns that underpin this thesis.
Another Way To Look At Valuation
The SWS DCF model suggests Helix is trading at $9.19 compared with an estimated future cash flow value of $15.49, which points to a sizeable undervaluation. With the share price already up strongly in recent months, do you see this gap as a margin of safety or a signal to be cautious?
Next Steps
With both upside potential and clear concerns on the table, it can be useful to move quickly and check the underlying numbers yourself. You can begin with our breakdown of 2 key rewards and 2 important warning signs.
Ready To Find Your Next Idea?
If Helix has sharpened your interest in energy and infrastructure, do not stop here. Use the Simply Wall St screener to uncover your next watchlist candidate.
- Target stability and income potential by scanning for companies with 15 dividend fortresses that might suit a steady cash flow focus.
- Hunt for value by reviewing 46 high quality undervalued stocks that currently trade below their estimated worth based on fundamentals.
- Prioritise capital preservation by checking out 77 resilient stocks with low risk scores that score well on financial strength and risk metrics.
This article by Simply Wall St is general in nature. We provide commentary based on historical data and analyst forecasts only using an unbiased methodology and our articles are not intended to be financial advice. It does not constitute a recommendation to buy or sell any stock, and does not take account of your objectives, or your financial situation. We aim to bring you long-term focused analysis driven by fundamental data. Note that our analysis may not factor in the latest price-sensitive company announcements or qualitative material. Simply Wall St has no position in any stocks mentioned.