How Asbury’s Rising EPS and Aggressive Buybacks Will Impact Asbury Automotive Group (ABG) Investors
Asbury Automotive Group, Inc. ABG | 0.00 |
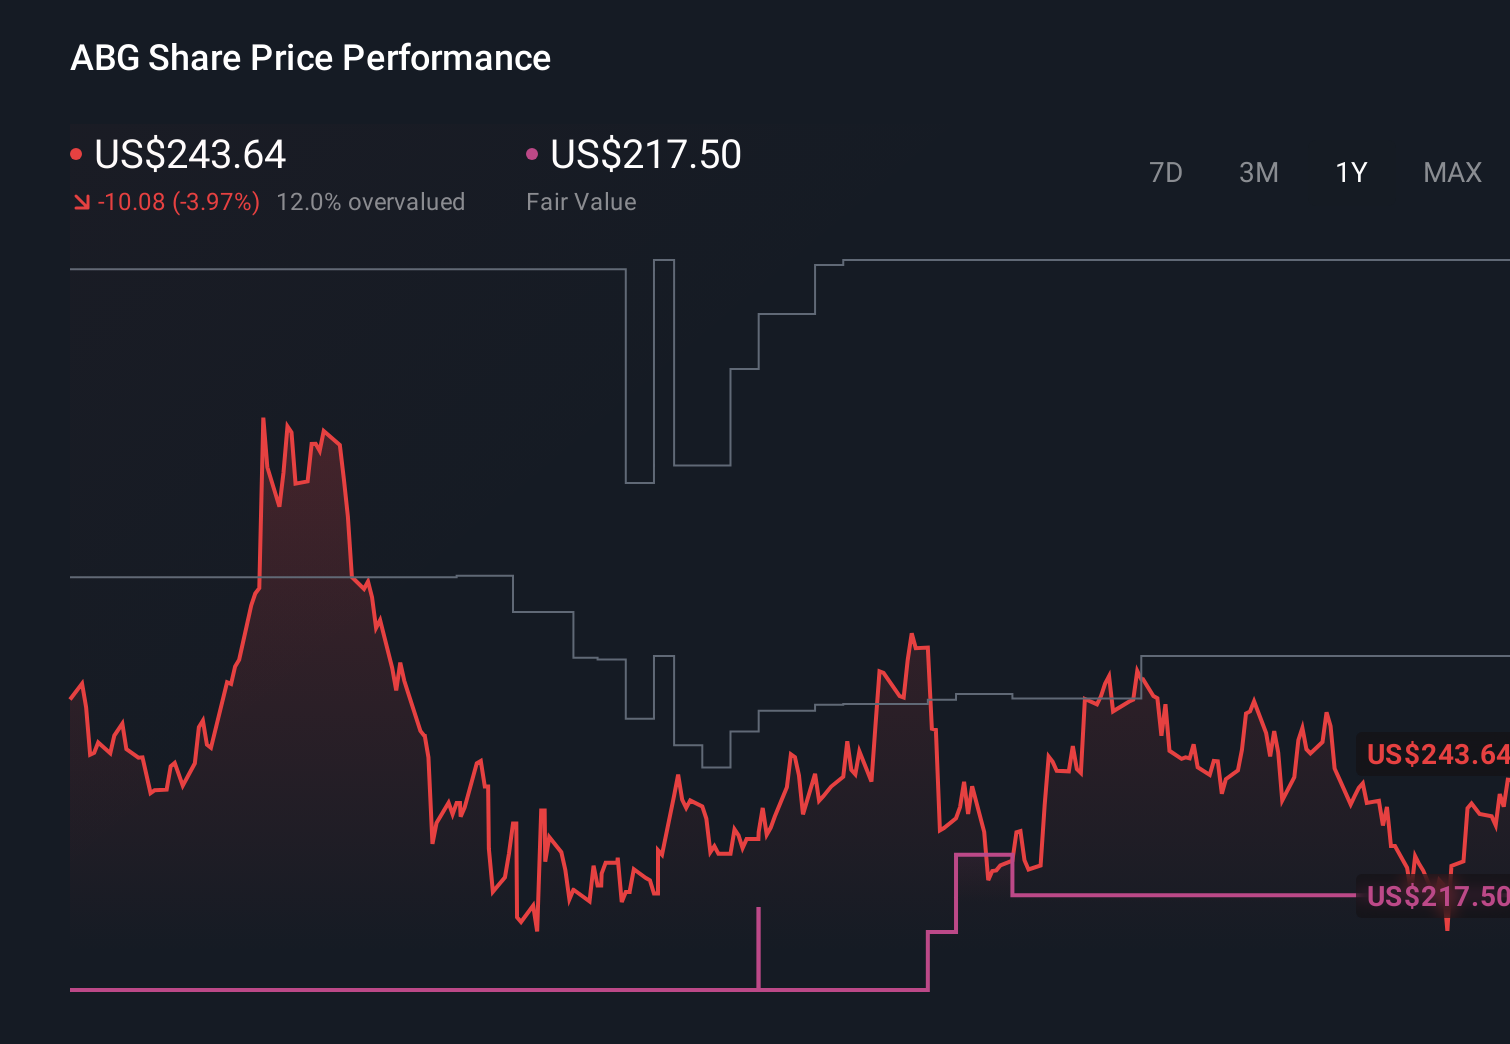
- In late April 2026, Asbury Automotive Group reported first-quarter revenue of US$4.11 billion, slightly below the prior year, while net income rose to US$187.8 million and diluted earnings per share from continuing operations climbed to US$9.87.
- Over the same period, Asbury repurchased 678,000 shares for US$147 million, completing a US$477.27 million program that retired 2,187,090 shares, indicating a strong focus on enhancing per-share metrics alongside profitability.
- With earnings per share jumping meaningfully despite flat revenue, we’ll now examine how this profitability improvement reshapes Asbury Automotive Group’s investment narrative.
We've uncovered the 12 dividend fortresses yielding 5%+ that don't just survive market storms, but thrive in them.
Asbury Automotive Group Investment Narrative Recap
To own Asbury Automotive Group, you need to believe its mix of acquisitions, digital tools and high margin service can offset pressure on traditional dealership sales and elevated leverage. The latest quarter’s flat revenue but sharply higher earnings, alongside continued buybacks, supports the near term catalyst of earnings per share growth, but does little to reduce the key risk that higher debt and integration challenges could weigh on flexibility if conditions worsen.
The most relevant recent announcement is the completion of Asbury’s US$477.27 million share repurchase program, retiring 2,187,090 shares, or about 11.06 percent of the company. Coming alongside stronger earnings per share in Q1 2026, this reinforces the current focus on enhancing per share metrics, which could amplify both the benefits of any future profit growth and the impact of risks such as slower unit volumes or higher financing costs.
Yet against this stronger per share picture, the risk that higher leverage and acquisition dependence could limit Asbury’s options is something investors should be aware of...
Asbury Automotive Group's narrative projects $20.7 billion revenue and $635.3 million earnings by 2029.
Uncover how Asbury Automotive Group's forecasts yield a $250.44 fair value, a 30% upside to its current price.
Exploring Other Perspectives
Some of the lowest analysts were already cautious, assuming only about US$20.9 billion in revenue and US$648 million in earnings by 2029, so you should recognize how much more pessimistic that view is and consider how Q1’s stronger US$187.8 million profit might shift both that outlook and the concerns about acquisitions and leverage over time.
Explore 2 other fair value estimates on Asbury Automotive Group - why the stock might be worth over 3x more than the current price!
Form Your Own Verdict
Don't just follow the ticker - dig into the data and build a conviction that's truly your own.
- A great starting point for your Asbury Automotive Group research is our analysis highlighting 5 key rewards and 1 important warning sign that could impact your investment decision.
- Our free Asbury Automotive Group research report provides a comprehensive fundamental analysis summarized in a single visual - the Snowflake - making it easy to evaluate Asbury Automotive Group's overall financial health at a glance.
Want Some Alternatives?
The market won't wait. These fast-moving stocks are hot now. Grab the list before they run:
- This technology could replace computers: discover 26 stocks that are working to make quantum computing a reality.
- Find 48 companies with promising cash flow potential yet trading below their fair value.
- Capitalize on the AI infrastructure supercycle with our selection of the 38 best 'picks and shovels' of the AI gold rush converting record-breaking demand into massive cash flow.
This article by Simply Wall St is general in nature. We provide commentary based on historical data and analyst forecasts only using an unbiased methodology and our articles are not intended to be financial advice. It does not constitute a recommendation to buy or sell any stock, and does not take account of your objectives, or your financial situation. We aim to bring you long-term focused analysis driven by fundamental data. Note that our analysis may not factor in the latest price-sensitive company announcements or qualitative material. Simply Wall St has no position in any stocks mentioned.