How GRAIL’s Narrowed Q1 2026 Loss Profile Will Impact GRAIL (GRAL) Investors
Grail GRAL | 0.00 |
- GRAIL, Inc. has reported past first-quarter 2026 results, with sales of US$39.83 million and revenue of US$40.79 million, alongside a reduced net loss of US$93.19 million and lower basic loss per share versus a year earlier.
- The combination of higher revenue and a smaller net loss suggests GRAIL’s multi-cancer early detection business is scaling while expenses are being managed more tightly.
- We’ll now examine how GRAIL’s improved first-quarter loss profile influences its existing investment narrative around growth, reimbursement, and profitability.
This technology could replace computers: discover 26 stocks that are working to make quantum computing a reality.
GRAIL Investment Narrative Recap
To own GRAIL, you need to believe that multi cancer early detection can become a routine part of care and that Galleri’s data, partnerships, and regulatory progress ultimately justify today’s heavy investment. The latest quarter’s higher revenue and smaller net loss improve the story at the margin but do not yet change the key near term catalyst, which remains regulatory and reimbursement progress, or the central risk around continued large losses and cash burn.
The upcoming Bank of America Global Healthcare Conference, where GRAIL’s CFO will present, looks particularly relevant here. With Q1 2026 numbers now out, this forum gives management a timely stage to frame how revenue growth, the reduced quarterly net loss of US$93.19 million, and ongoing PMA and reimbursement efforts fit together with the company’s runway and expectations around spending, which are central to both the growth and profitability narratives.
Yet against this improving loss profile, the ongoing risk that large net losses could require further capital raising is something investors should be aware of...
GRAIL's narrative projects $310.9 million in revenue and $41.1 million in earnings by 2029. This requires 25.8% yearly revenue growth and a $436.4 million earnings increase from -$395.3 million today.
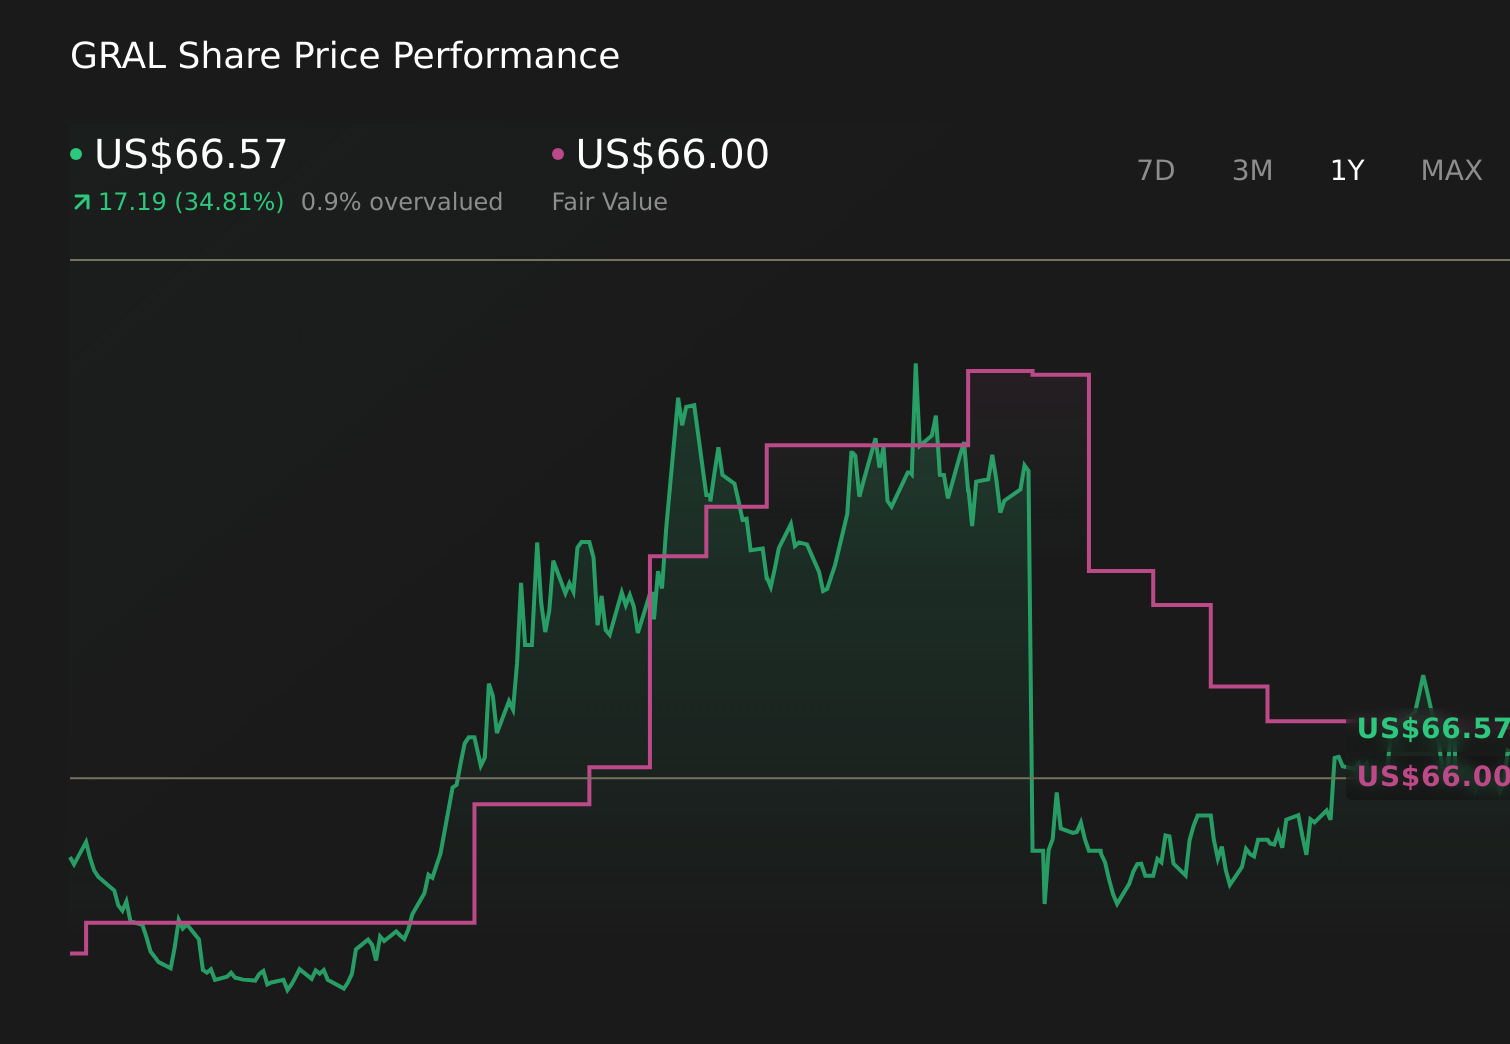
Uncover how GRAIL's forecasts yield a $67.71 fair value, a 12% upside to its current price.
Exploring Other Perspectives
Before this quarter’s results, the most optimistic analysts were assuming revenue could reach about US$343 million by 2029, with earnings turning positive, which is a far more upbeat view than the baseline risk that persistent heavy losses and cash needs could force more shareholder dilution, and Q1’s smaller loss may or may not shift those expectations as the story develops.
Explore 5 other fair value estimates on GRAIL - why the stock might be worth less than half the current price!
Decide For Yourself
Don't just follow the ticker - dig into the data and build a conviction that's truly your own.
- A great starting point for your GRAIL research is our analysis highlighting 2 key rewards and 5 important warning signs that could impact your investment decision.
- Our free GRAIL research report provides a comprehensive fundamental analysis summarized in a single visual - the Snowflake - making it easy to evaluate GRAIL's overall financial health at a glance.
Seeking Other Investments?
Our daily scans reveal stocks with breakout potential. Don't miss this chance:
- The future of work is here. Discover the 31 top robotics and automation stocks leading the charge in AI-driven automation and industrial transformation.
- AI is about to change healthcare. These 33 stocks are working on everything from early diagnostics to drug discovery. The best part - they are all under $10b in market cap - there's still time to get in early.
- We've uncovered the 14 dividend fortresses yielding 5%+ that don't just survive market storms, but thrive in them.
This article by Simply Wall St is general in nature. We provide commentary based on historical data and analyst forecasts only using an unbiased methodology and our articles are not intended to be financial advice. It does not constitute a recommendation to buy or sell any stock, and does not take account of your objectives, or your financial situation. We aim to bring you long-term focused analysis driven by fundamental data. Note that our analysis may not factor in the latest price-sensitive company announcements or qualitative material. Simply Wall St has no position in any stocks mentioned.