How Investors Are Reacting To CME Group (CME) Q1 Earnings Beat and Completed Share Buyback
CME Group Inc. Class A CME | 0.00 |
- CME Group Inc. reported past first-quarter 2026 results with revenue of US$1,880.1 million and net income of US$1,154.3 million, alongside higher basic and diluted earnings per share from continuing operations compared with a year earlier.
- During the same period, CME Group completed a US$800.12 million share repurchase program that reduced its share count by 0.77%, incrementally lifting earnings per share.
- We’ll now examine how CME Group’s strong first-quarter earnings growth and completed share repurchase program interact with its existing investment narrative.
Find 51 companies with promising cash flow potential yet trading below their fair value.
CME Group Investment Narrative Recap
To own CME Group, you need to be comfortable with a business that depends heavily on healthy derivatives activity and stable trading infrastructure, while being exposed to swings in market volatility and regulation. The strong first quarter 2026 earnings and incremental EPS lift from buybacks support the existing thesis, but do not materially change the key short term catalyst of trading volume trends or the main risk of weaker volume in core rate and equity products.
Among recent announcements, the April 2026 average daily volume of 25.9 million contracts stands out as most relevant, because it ties directly into the volume driven earnings catalyst that underpins CME’s investment case. It also provides a useful counterpoint to softer agricultural sentiment captured in the Ag Economy Barometer, highlighting how shifting end user confidence can matter for certain product lines even when headline volumes remain strong.
Yet behind these strong results and healthy volumes, there is a risk investors should be aware of if volatility in core interest rate and equity futures were to...
CME Group's narrative projects $7.8 billion revenue and $4.6 billion earnings by 2029.
Uncover how CME Group's forecasts yield a $308.20 fair value, a 7% upside to its current price.
Exploring Other Perspectives
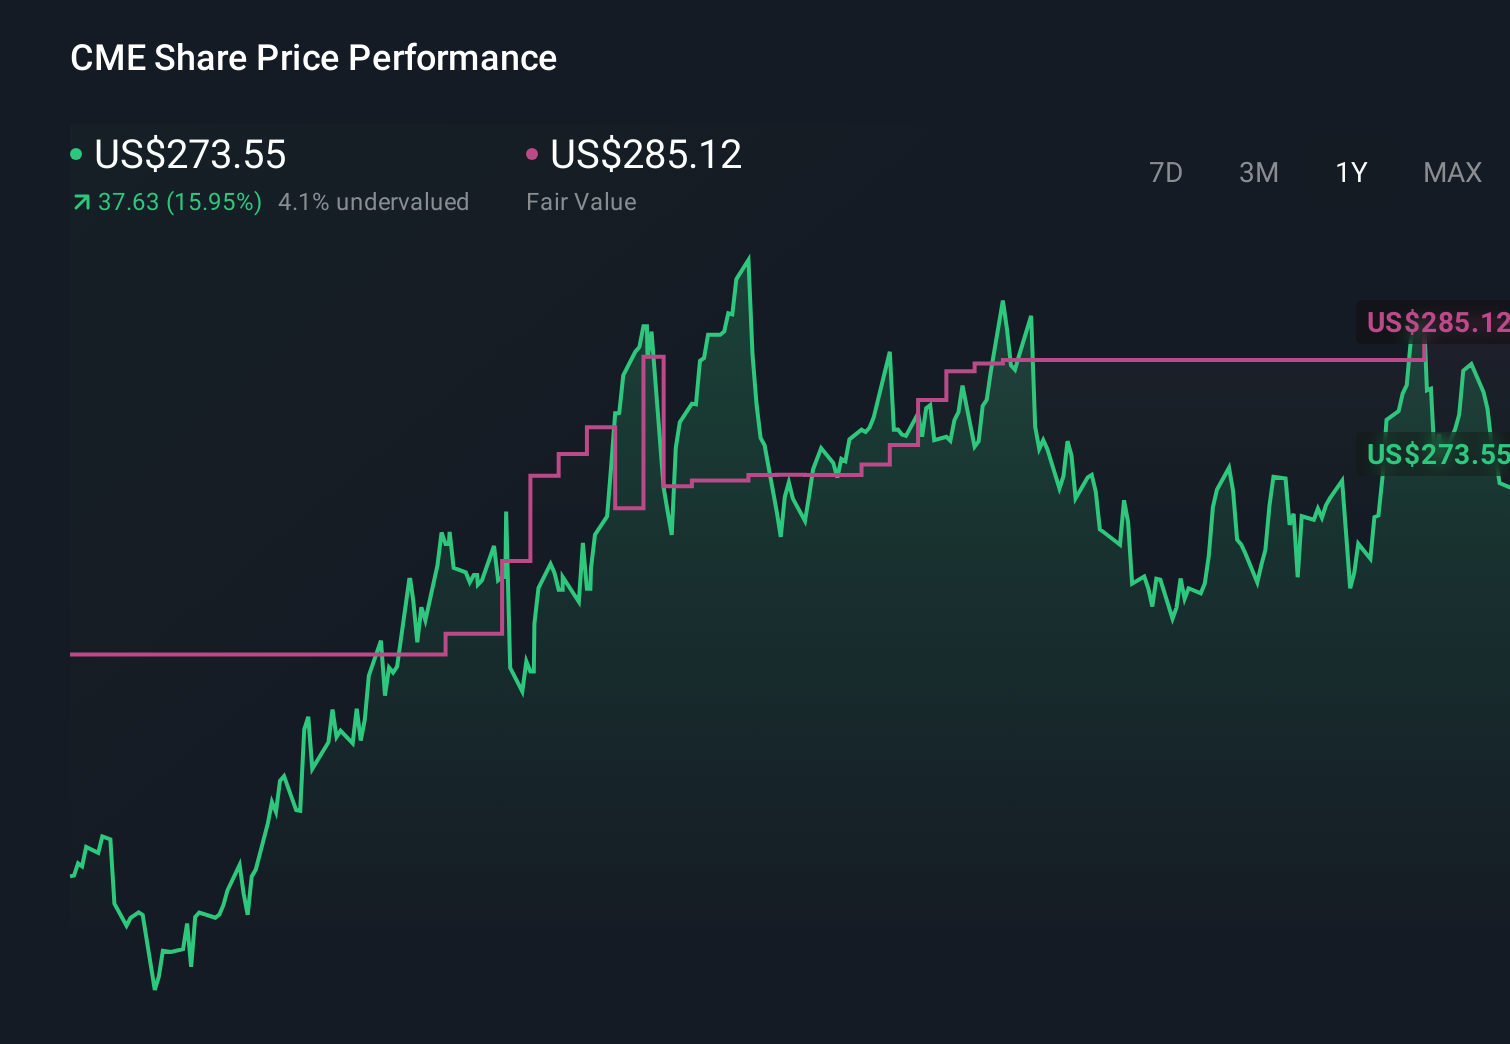
Four members of the Simply Wall St Community currently see CME Group’s fair value between US$245.06 and US$308.20, underscoring how far opinions can differ. Against that spread, CME’s reliance on volumes in interest rate and equity futures means any sustained drop in volatility could have broader implications for the company’s earnings power, so it is worth exploring several of these viewpoints before deciding how you feel about the stock.
Explore 4 other fair value estimates on CME Group - why the stock might be worth as much as 7% more than the current price!
Decide For Yourself
Disagree with existing narratives? Extraordinary investment returns rarely come from following the herd, so go with your instincts.
- A great starting point for your CME Group research is our analysis highlighting 2 key rewards and 2 important warning signs that could impact your investment decision.
- Our free CME Group research report provides a comprehensive fundamental analysis summarized in a single visual - the Snowflake - making it easy to evaluate CME Group's overall financial health at a glance.
Curious About Other Options?
The market won't wait. These fast-moving stocks are hot now. Grab the list before they run:
- Rare earth metals are the new gold rush. Find out which 30 stocks are leading the charge.
- We've uncovered the 13 dividend fortresses yielding 5%+ that don't just survive market storms, but thrive in them.
- This technology could replace computers: discover 26 stocks that are working to make quantum computing a reality.
This article by Simply Wall St is general in nature. We provide commentary based on historical data and analyst forecasts only using an unbiased methodology and our articles are not intended to be financial advice. It does not constitute a recommendation to buy or sell any stock, and does not take account of your objectives, or your financial situation. We aim to bring you long-term focused analysis driven by fundamental data. Note that our analysis may not factor in the latest price-sensitive company announcements or qualitative material. Simply Wall St has no position in any stocks mentioned.