How Investors Are Reacting To Enterprise Products Partners (EPD) Record Q1 Volumes And Robust Distribution Coverage
Enterprise Products EPD | 0.00 |
- In recent days, Enterprise Products Partners reported record first-quarter 2026 operating volumes across its integrated midstream network and distributable cash flow that covered its distribution 1.8 times, while also extending its streak of annual distribution increases to 27 years.
- This combination of resilient cash generation, disciplined reinvestment into new processing and export projects, and consistently rising payouts underscores Enterprise’s appeal to investors focused on recurring income from midstream infrastructure.
- Next, we’ll examine how this strong distribution coverage and cash retention pipeline could influence Enterprise Products Partners’ existing investment narrative.
AI is about to change healthcare. These 39 stocks are working on everything from early diagnostics to drug discovery. The best part - they are all under $10b in market cap - there's still time to get in early.
Enterprise Products Partners Investment Narrative Recap
To own Enterprise Products Partners, you need to believe in the stability of its fee-based midstream network and its ability to keep turning high volumes into steady cash distributions. The latest record Q1 2026 operating volumes and 1.8 times distribution coverage support that view and appear to reinforce, rather than change, the near term focus on execution of new processing and export projects, while key risks still center on operational reliability and balance sheet leverage.
Among recent announcements, the Q1 2026 distribution increase to US$0.55 per unit, extending the 27 year growth streak, stands out in light of the strong coverage ratio. It ties directly into the current catalyst of bringing new Permian gas plants and export capacity online, as retained cash and disciplined reinvestment aim to preserve distribution quality while funding growth projects without stretching the balance sheet.
Yet behind this solid coverage, investors should still pay close attention to how Enterprise manages its sizeable US$31.9 billion debt load and...
Enterprise Products Partners’ narrative projects $61.4 billion revenue and $7.5 billion earnings by 2029. This requires 6.0% yearly revenue growth and a $1.7 billion earnings increase from $5.8 billion today.
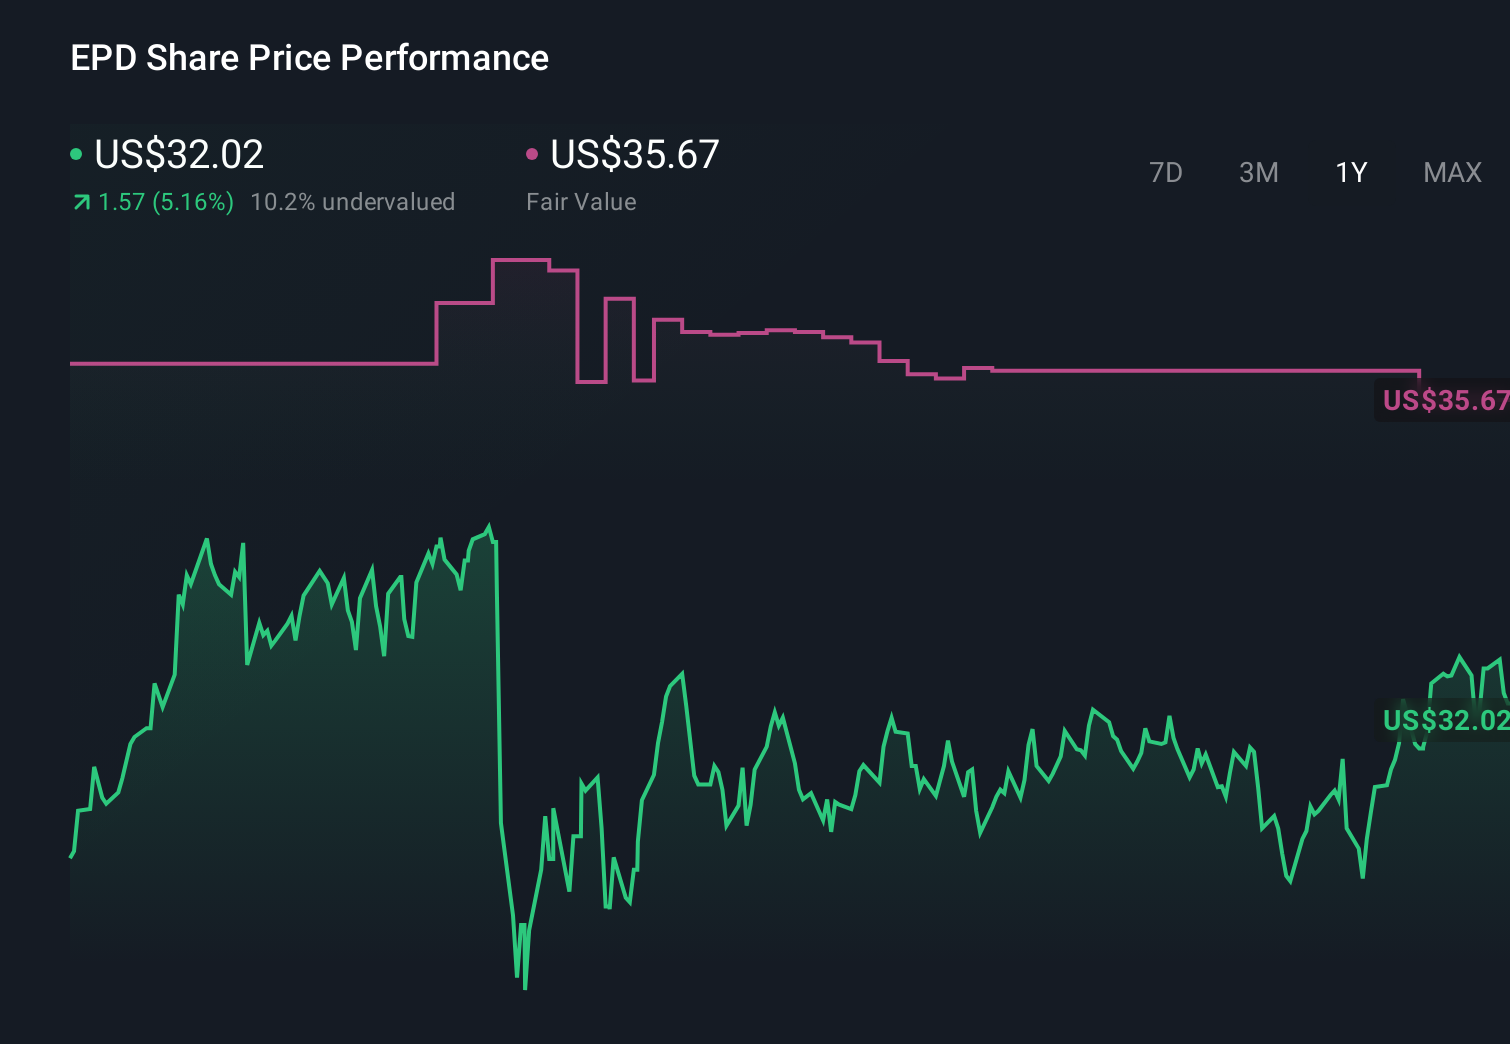
Uncover how Enterprise Products Partners' forecasts yield a $41.30 fair value, a 9% upside to its current price.
Exploring Other Perspectives
Six fair value estimates from the Simply Wall St Community span roughly US$34 to US$92 per unit, showing how widely views can differ. When you weigh those opinions against the current focus on new processing and export projects as key catalysts, it becomes even more important to compare multiple perspectives on how these developments might influence Enterprise’s future performance.
Explore 6 other fair value estimates on Enterprise Products Partners - why the stock might be worth 9% less than the current price!
Reach Your Own Conclusion
Don't just follow the ticker - dig into the data and build a conviction that's truly your own.
- A great starting point for your Enterprise Products Partners research is our analysis highlighting 4 key rewards and 2 important warning signs that could impact your investment decision.
- Our free Enterprise Products Partners research report provides a comprehensive fundamental analysis summarized in a single visual - the Snowflake - making it easy to evaluate Enterprise Products Partners' overall financial health at a glance.
Contemplating Other Strategies?
Right now could be the best entry point. These picks are fresh from our daily scans. Don't delay:
- Invest in the nuclear renaissance through our list of 88 elite nuclear energy infrastructure plays powering the global AI revolution.
- Uncover the next big thing with 25 elite penny stocks that balance risk and reward.
- The latest GPUs need a type of rare earth metal called Neodymium and there are only 28 companies in the world exploring or producing it. Find the list for free.
This article by Simply Wall St is general in nature. We provide commentary based on historical data and analyst forecasts only using an unbiased methodology and our articles are not intended to be financial advice. It does not constitute a recommendation to buy or sell any stock, and does not take account of your objectives, or your financial situation. We aim to bring you long-term focused analysis driven by fundamental data. Note that our analysis may not factor in the latest price-sensitive company announcements or qualitative material. Simply Wall St has no position in any stocks mentioned.