How Investors Are Reacting To GRAIL (GRAL) Mixed NHS-Galleri Trial Results And Ongoing Net Losses
Grail GRAL | 54.99 | +2.59% |
- GRAIL, Inc. recently reported fourth-quarter and full-year 2025 results, showing higher sales and revenue alongside continued net losses, and released topline data from the large NHS-Galleri trial in England evaluating its Galleri multi-cancer blood test in a real-world screening setting.
- Although the NHS-Galleri trial did not meet its primary endpoint of statistically significant Stage III–IV cancer reduction, it indicated meaningful shifts toward earlier-stage detection and fewer emergency cancer diagnoses, outcomes that could be important for both health systems and regulators assessing multi-cancer screening programs.
- We’ll now examine how the mixed yet encouraging NHS-Galleri outcomes could reshape GRAIL’s investment narrative around Galleri’s real-world impact.
The future of work is here. Discover the 31 top robotics and automation stocks leading the charge in AI-driven automation and industrial transformation.
GRAIL Investment Narrative Recap
To own GRAIL, you have to believe multi cancer early detection can mature into a widely adopted screening category, with Galleri viewed as a clinically useful, reimbursed tool despite current losses. The NHS Galleri topline data is a mixed but important step for that thesis, and now looks central to the short term catalyst around FDA review and payer decisions, while the main risk remains significant ongoing net losses alongside uncertain reimbursement timelines.
The most immediate tie to this thesis is GRAIL’s February earnings release, which showed higher 2025 revenue of US$147.2 million but a substantial full year net loss of US$408.4 million. That contrast highlights how heavily the investment case leans on clinical and regulatory catalysts like the NHS Galleri readout and the pending FDA PMA rather than current profitability, and raises questions about how long the company can fund its growth path without further dilution.
Yet investors should also be aware that the unresolved questions around payer coverage and the scale of future capital needs could...
GRAIL’s narrative projects $232.5 million revenue and $37.3 million earnings by 2028. This requires 20.1% yearly revenue growth and an earnings increase of about $480 million from -$443.0 million today.
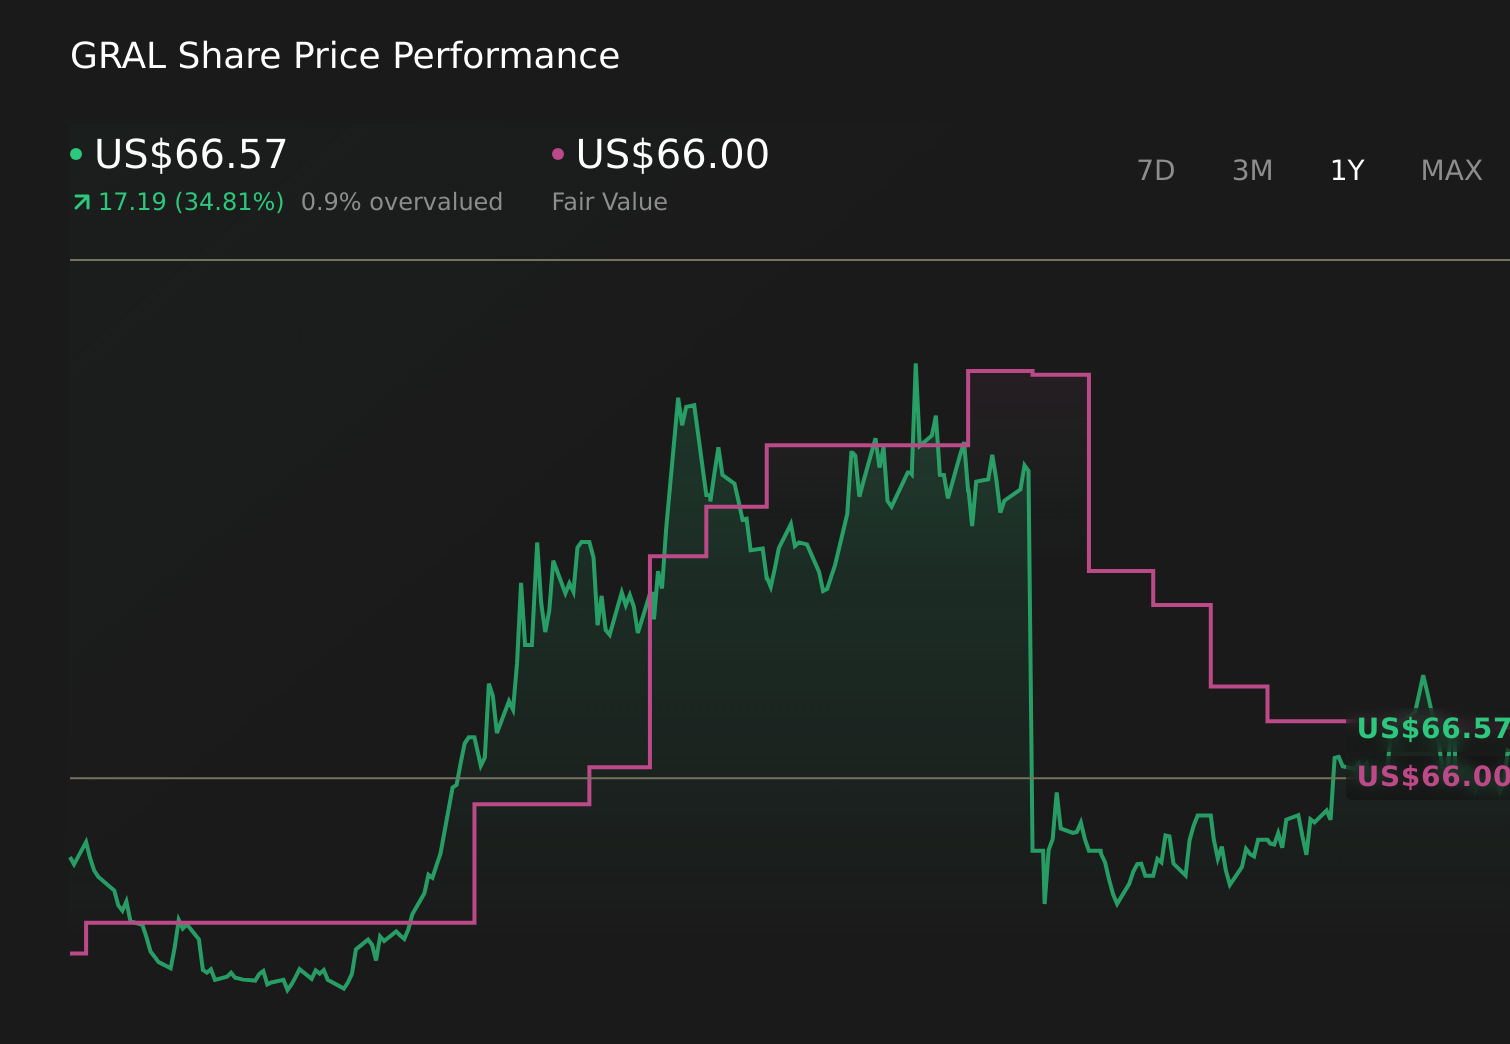
Uncover how GRAIL's forecasts yield a $114.50 fair value, a 112% upside to its current price.
Exploring Other Perspectives
Before this news, the most optimistic analysts were banking on about 32.6% annual revenue growth and a swing to US$53.8 million in earnings, but the mixed NHS Galleri result and heavy losses show how different your view can be if you focus more on trial endpoints and regulatory timing than on those bullish long range targets.
Explore 5 other fair value estimates on GRAIL - why the stock might be worth 46% less than the current price!
Decide For Yourself
Disagree with existing narratives? Extraordinary investment returns rarely come from following the herd, so go with your instincts.
- A great starting point for your GRAIL research is our analysis highlighting 1 key reward and 4 important warning signs that could impact your investment decision.
- Our free GRAIL research report provides a comprehensive fundamental analysis summarized in a single visual - the Snowflake - making it easy to evaluate GRAIL's overall financial health at a glance.
No Opportunity In GRAIL?
Don't miss your shot at the next 10-bagger. Our latest stock picks just dropped:
- Explore 22 top quantum computing companies leading the revolution in next-gen technology and shaping the future with breakthroughs in quantum algorithms, superconducting qubits, and cutting-edge research.
- The latest GPUs need a type of rare earth metal called Neodymium and there are only 29 companies in the world exploring or producing it. Find the list for free.
- Find 47 companies with promising cash flow potential yet trading below their fair value.
This article by Simply Wall St is general in nature. We provide commentary based on historical data and analyst forecasts only using an unbiased methodology and our articles are not intended to be financial advice. It does not constitute a recommendation to buy or sell any stock, and does not take account of your objectives, or your financial situation. We aim to bring you long-term focused analysis driven by fundamental data. Note that our analysis may not factor in the latest price-sensitive company announcements or qualitative material. Simply Wall St has no position in any stocks mentioned.