How Investors Are Reacting To Trinity Industries (TRN) Mounting Backlog Pressure And Cash Flow Strain
Trinity Industries, Inc. TRN | 0.00 |
- In recent commentary, Trinity Industries reported a sharp reduction in its railcar order backlog over the past two years, alongside persistently low gross margins and weakening free cash flow, pointing to mounting operational and financial pressures.
- This combination of declining future work visibility and rising cash demands underlines how Trinity’s capital-intensive model can strain performance when new order momentum slows.
- Next, we’ll examine how concerns about Trinity’s shrinking backlog could reshape the earlier investment narrative around volume recovery and margin improvement.
Uncover the next big thing with 24 elite penny stocks that balance risk and reward.
Trinity Industries Investment Narrative Recap
To own Trinity Industries, you need to believe that railcar demand and leasing economics will support steady utilization and pricing, even as the company works through a capital intensive model. The sharp backlog decline and weaker free cash flow directly challenge that thesis, increasing uncertainty around the near term volume recovery narrative while reinforcing the key risk today that cash generation may not comfortably support both reinvestment and shareholder returns if orders stay soft.
The most relevant recent announcement is Trinity’s Q1 2026 update, where the company reported lower revenue but modestly higher net income and raised full year EPS guidance to US$2.20 to US$2.40. Set against the shrinking backlog and pressured free cash flow, that guidance puts more weight on management’s ability to protect margins and execute efficiently in the short term, even as questions grow about how resilient earnings will be if order activity fails to re accelerate.
Yet behind the higher EPS guidance, investors should be aware of the growing tension between Trinity’s dividend, elevated debt costs, and...
Trinity Industries' narrative projects $2.6 billion revenue and $118.9 million earnings by 2029. This requires 8.3% yearly revenue growth and a $143.4 million earnings decrease from $262.3 million today.
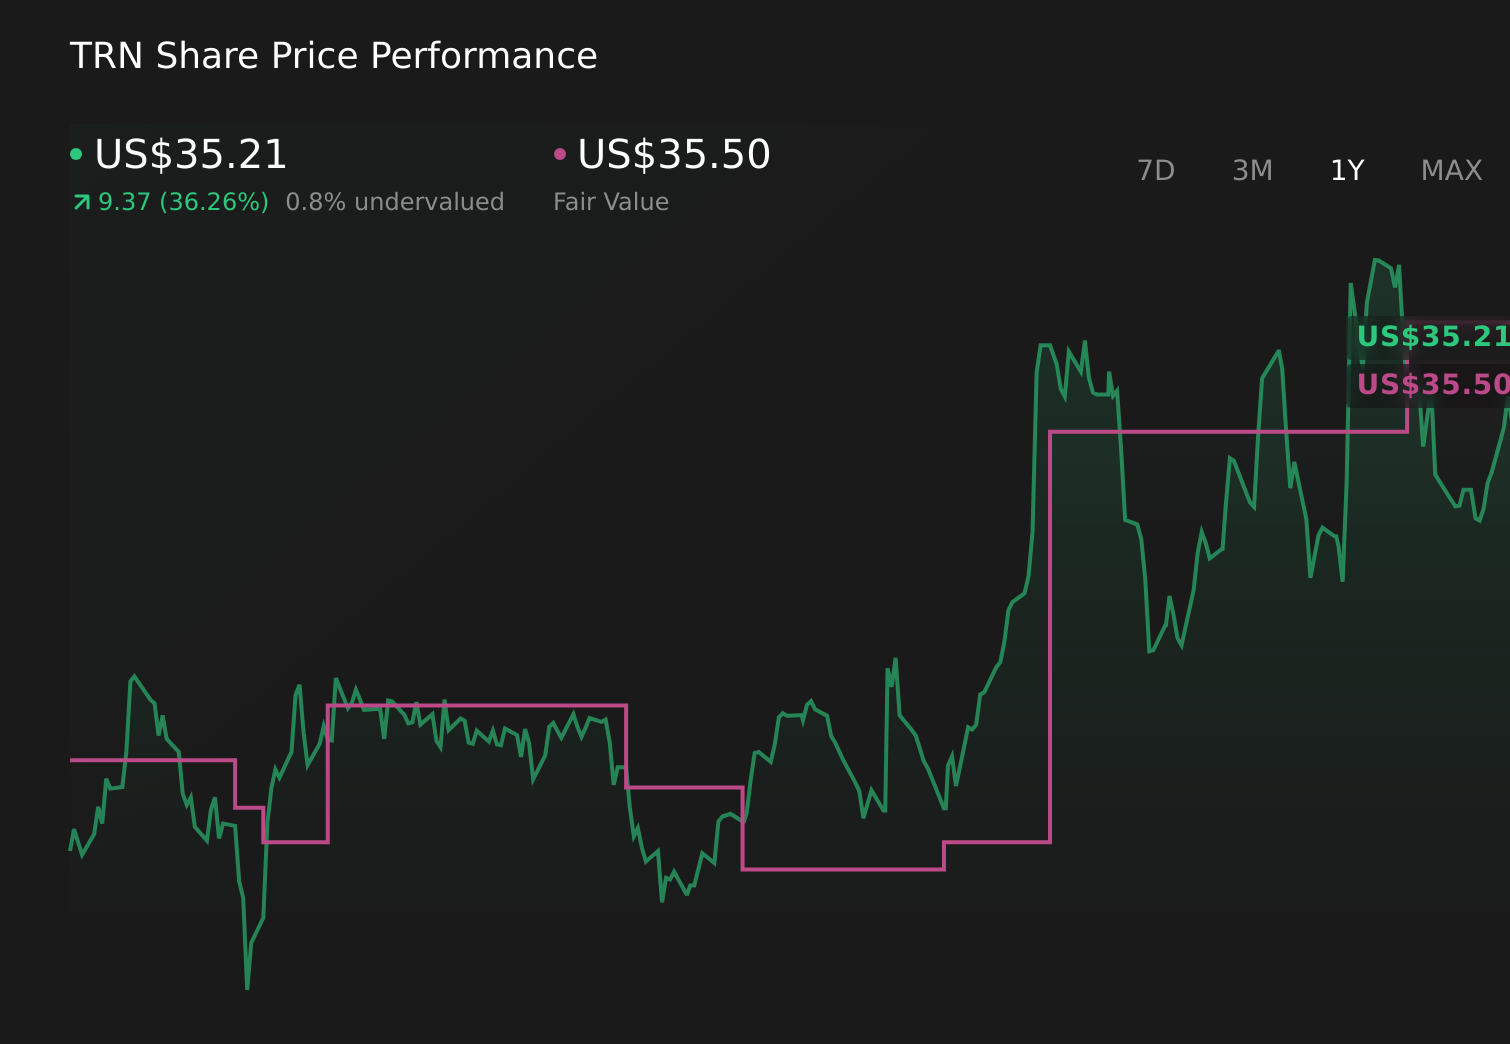
Uncover how Trinity Industries' forecasts yield a $35.50 fair value, a 11% upside to its current price.
Exploring Other Perspectives
Two fair value estimates from the Simply Wall St Community span a wide range between about US$21.08 and US$35.50 per share, highlighting very different expectations. You can compare these to concerns about Trinity’s shrinking backlog and cash burn to judge how such operational pressures might influence the company’s longer term performance and explore several alternative viewpoints.
Explore 2 other fair value estimates on Trinity Industries - why the stock might be worth as much as 11% more than the current price!
The Verdict Is Yours
Don't just follow the ticker - dig into the data and build a conviction that's truly your own.
- A great starting point for your Trinity Industries research is our analysis highlighting 3 key rewards and 4 important warning signs that could impact your investment decision.
- Our free Trinity Industries research report provides a comprehensive fundamental analysis summarized in a single visual - the Snowflake - making it easy to evaluate Trinity Industries' overall financial health at a glance.
No Opportunity In Trinity Industries?
The market won't wait. These fast-moving stocks are hot now. Grab the list before they run:
- AI is about to change healthcare. These 39 stocks are working on everything from early diagnostics to drug discovery. The best part - they are all under $10b in market cap - there's still time to get in early.
- Find 47 companies with promising cash flow potential yet trading below their fair value.
- Rare earth metals are the new gold rush. Find out which 32 stocks are leading the charge.
This article by Simply Wall St is general in nature. We provide commentary based on historical data and analyst forecasts only using an unbiased methodology and our articles are not intended to be financial advice. It does not constitute a recommendation to buy or sell any stock, and does not take account of your objectives, or your financial situation. We aim to bring you long-term focused analysis driven by fundamental data. Note that our analysis may not factor in the latest price-sensitive company announcements or qualitative material. Simply Wall St has no position in any stocks mentioned.