

How Investors May Respond To Exelon (EXC) Balancing Storm Recovery Costs With Steady Utility Earnings
Exelon Corporation EXC | 0.00 |
- Exelon Corporation previously reported second-quarter 2026 results showing revenue of US$5,967 million and net income of US$396 million, while its ComEd utility has recently been restoring power to hundreds of thousands of customers in northern Illinois after severe storms.
- The combination of steady earnings and intense storm-recovery operations highlights how Exelon’s regulated utilities are being tested on reliability, resilience, and cost recovery amid increasingly disruptive weather.
- We’ll now examine how Exelon’s large-scale storm restoration efforts, and the operational and regulatory pressures they bring, affect its investment narrative.
Invest in the nuclear renaissance through our list of 90 elite nuclear energy infrastructure plays powering the global AI revolution.
Exelon Investment Narrative Recap
To own Exelon, you have to believe that regulated utilities with dense urban footprints can earn a fair return on heavy grid investments while managing rising storm costs. The recent Illinois outages reinforce that the key short term catalyst is constructive regulatory support for cost recovery, while the biggest risk remains that mounting weather related expenses are only partially recoverable. At this stage, the latest storm work does not appear to materially change that risk reward balance.
The most relevant update here is Exelon’s second quarter 2026 earnings, which showed revenue of US$5,967 million and net income of US$396 million, broadly in line with recent performance. Those results suggest the company is absorbing frequent storm activity without clear near term earnings disruption, but the real test for investors is how future rate cases reflect the higher restoration and resilience spend now flowing through the system.
Yet behind this seemingly stable picture, investors should be aware that storm costs and regulatory recovery could...
Exelon's narrative projects $27.4 billion revenue and $3.5 billion earnings by 2029. This requires 3.4% yearly revenue growth and a $0.7 billion earnings increase from $2.8 billion today.
Uncover how Exelon's forecasts yield a $49.33 fair value, a 9% upside to its current price.
Exploring Other Perspectives
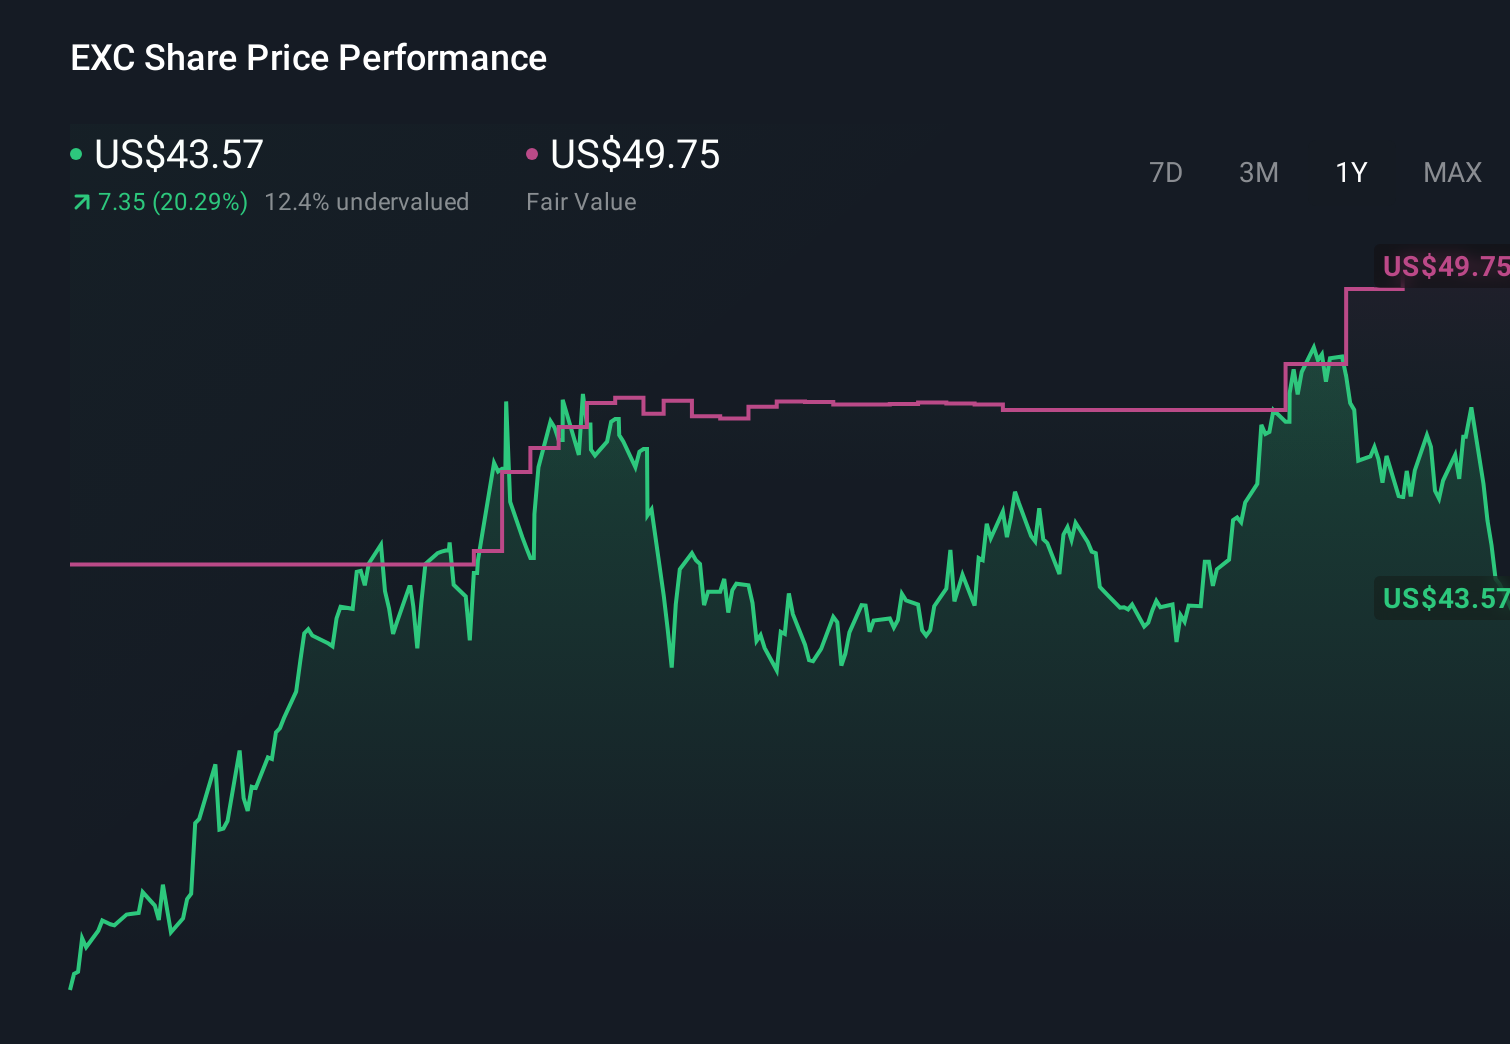
Simply Wall St Community members have only two fair value estimates for Exelon, stretching from US$6.58 to US$49.33 per share. Given this spread, you may want to compare those views with the risk that more frequent severe weather raises restoration costs and puts extra pressure on Exelon’s regulated earnings profile.
Explore 2 other fair value estimates on Exelon - why the stock might be worth as much as 9% more than the current price!
The Verdict Is Yours
Disagree with existing narratives? Extraordinary investment returns rarely come from following the herd, so go with your instincts.
- A great starting point for your Exelon research is our analysis highlighting 4 key rewards and 2 important warning signs that could impact your investment decision.
- Our free Exelon research report provides a comprehensive fundamental analysis summarized in a single visual - the Snowflake - making it easy to evaluate Exelon's overall financial health at a glance.
Looking For Alternative Opportunities?
Our daily scans reveal stocks with breakout potential. Don't miss this chance:
- The latest GPUs need a type of rare earth metal called Dysprosium and there are only 28 companies in the world exploring or producing it. Find the list for free.
- The future of work is here. Discover the 39 top robotics and automation stocks leading the charge in AI-driven automation and industrial transformation.
- Uncover the next big thing with 19 elite penny stocks that balance risk and reward.
This article by Simply Wall St is general in nature. We provide commentary based on historical data and analyst forecasts only using an unbiased methodology and our articles are not intended to be financial advice. It does not constitute a recommendation to buy or sell any stock, and does not take account of your objectives, or your financial situation. We aim to bring you long-term focused analysis driven by fundamental data. Note that our analysis may not factor in the latest price-sensitive company announcements or qualitative material. Simply Wall St has no position in any stocks mentioned.