

How Investors May Respond To Nelnet (NNI) Earnings Drop Amid Ongoing Dividend And Completed Buyback
Nelnet, Inc. Class A NNI | 0.00 |
- Nelnet, Inc. previously reported second-quarter 2026 net income of US$66.66 million, with basic earnings per share from continuing operations of US$1.85, down from US$181.46 million and US$4.97 a year earlier, while also declaring a third-quarter dividend of US$0.33 per share and completing a share repurchase program totaling 780,761 shares.
- The combination of weaker year-on-year earnings, continued dividend payments, and completion of the previously announced buyback gives a mixed signal about Nelnet’s current profit trends and capital return priorities.
- We’ll now examine how the sharp year-on-year earnings drop, alongside ongoing dividends and buybacks, shapes Nelnet’s broader investment narrative.
Outshine the giants: these 17 early-stage AI stocks could fund your retirement.
What Is Nelnet's Investment Narrative?
For someone holding Nelnet, the core belief is that its mix of loan servicing, education services, and financial products can keep producing solid, if uneven, cash flows, even as headline earnings bounce around. The latest quarter’s sharp profit drop, alongside an unchanged US$0.33 dividend and the completion of a US$96.78 million buyback, underlines that tension: profitability has clearly softened in the short term, yet management is still comfortable returning capital. That combination is unlikely to change the near-term story that key catalysts sit around earnings stability, funding costs, and any shifts in federal or private education finance. What may have changed is the risk balance: weaker recent earnings and debt that is not well covered by operating cash flow now stand out more starkly against a still-active capital return profile.
However, there is a growing gap between Nelnet’s recent earnings trend and its ongoing capital returns that investors should be aware of. Nelnet's share price has been on the slide but might be dropping deeper into value territory. Find out whether it's a bargain at this price.Exploring Other Perspectives
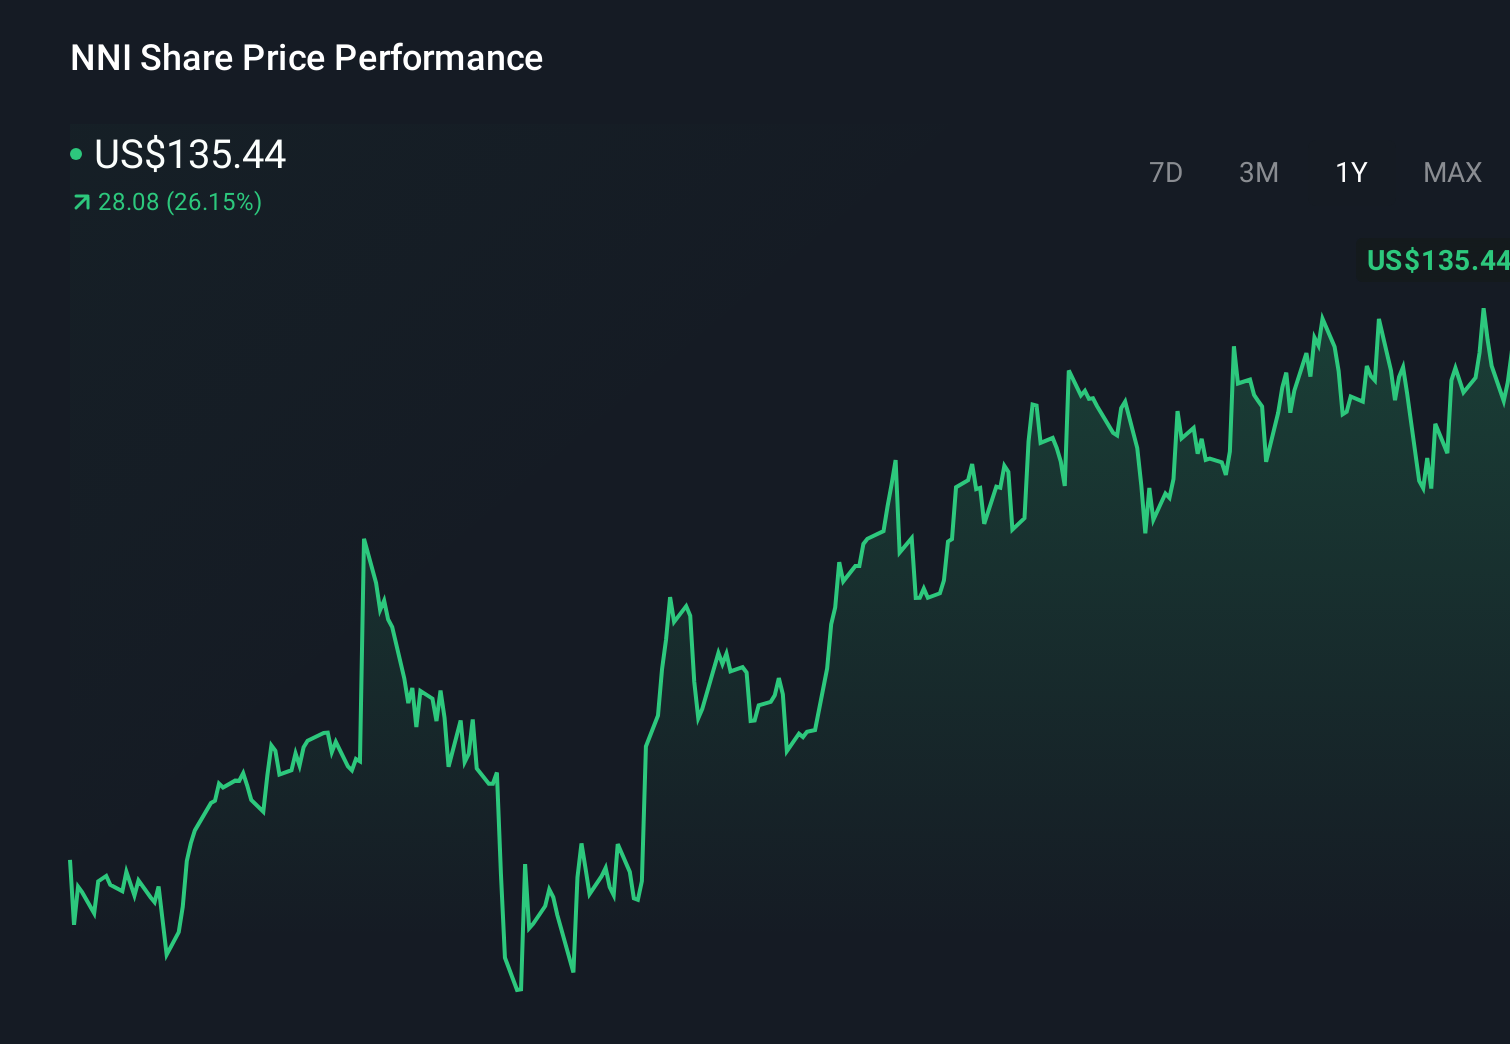
Two Simply Wall St Community fair value views range from about US$20.56 to US$130, underscoring how far apart private investors can be. Set against recent earnings pressure and thinner coverage of debt by operating cash flow, that spread hints at very different expectations for how resilient Nelnet’s business model will prove over time, and invites you to weigh several competing narratives before taking a view.
Explore 2 other fair value estimates on Nelnet - why the stock might be worth less than half the current price!
Form Your Own Verdict
Disagree with this assessment? Extraordinary investment returns rarely come from following the herd, so go with your instincts.
- A great starting point for your Nelnet research is our analysis highlighting 1 key reward and 2 important warning signs that could impact your investment decision.
- Our free Nelnet research report provides a comprehensive fundamental analysis summarized in a single visual - the Snowflake - making it easy to evaluate Nelnet's overall financial health at a glance.
Seeking Other Investments?
Markets shift fast. These stocks won't stay hidden for long. Get the list while it matters:
- This technology could replace computers: discover 24 stocks that are working to make quantum computing a reality.
- Capitalize on the AI infrastructure supercycle with our selection of the 55 best 'picks and shovels' of the AI gold rush converting record-breaking demand into massive cash flow.
- The future of work is here. Discover the 37 top robotics and automation stocks leading the charge in AI-driven automation and industrial transformation.
This article by Simply Wall St is general in nature. We provide commentary based on historical data and analyst forecasts only using an unbiased methodology and our articles are not intended to be financial advice. It does not constitute a recommendation to buy or sell any stock, and does not take account of your objectives, or your financial situation. We aim to bring you long-term focused analysis driven by fundamental data. Note that our analysis may not factor in the latest price-sensitive company announcements or qualitative material. Simply Wall St has no position in any stocks mentioned.